What is the Experience Stages Dimension?
min read - Updated on Oct 30, 2026Experience Stages is the Dimension that asks every piece of customer feedback "When does this occur?" It shows the time, moment or stage in which the described experience takes place: while comparing options, at checkout, on delivery day, during setup, after months of use or when contacting support. Kimola groups the same stage across all of your reviews, survey responses and support conversations and counts the records behind each one, so you see where in the customer journey your feedback comes from and how much of it each stage accounts for. Experience Stages belongs to the Context group and is available in every package.
A Dimension is a research question Kimola asks of every piece of feedback. Themes tell you what customers talk about, and sentiment tells you how they feel about it. Experience Stages tells you when it happened, so a complaint or a compliment can be placed on the customer journey. Every answer stays tied to the feedback that gives it, so you can open the records behind a stage and read them.
To use Experience Stages, you need a Kimola account and customer feedback to analyze. If you don’t have an account yet, sign up first.
For a Report, sign in and open the report you want to work with from the Reports section. If you haven’t created a report yet, follow one of these guides: Create a Report by Uploading a Custom Dataset, Create a Report by Adding Links
You can select Experience Stages while creating the Report or add it later. See Use It in Kimola.
For a Space, you need a Funnel with an Experience Stages Dimension model. If you haven’t set these up yet, see Create a Funnel, Add Dimensions to a Funnel and Create a Space. Upload feedback to the Space after adding the model so it can be classified with Experience Stages.
The Question It Asks
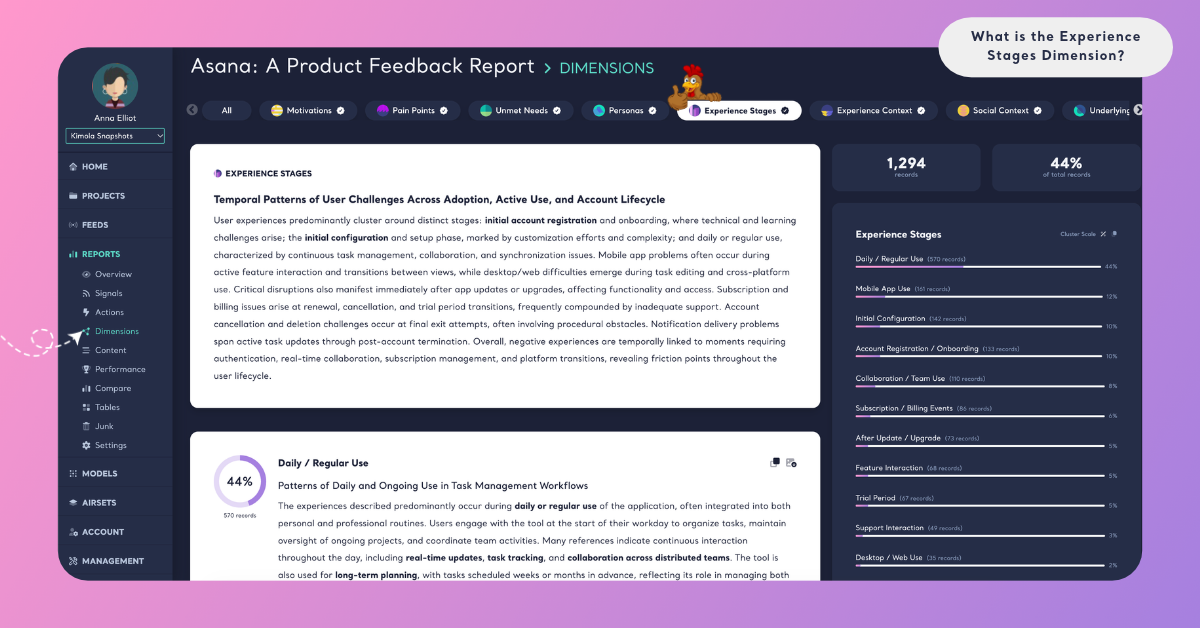
Experience Stages asks one question of each record: "When does this occur?" The answer is a stage or a moment, taken from what the feedback says. It can be a step of the customer journey, such as researching, buying, delivery, setup, first use, everyday use, renewal or contacting support. It can also be a moment in the customer's day or year, such as the morning commute, a lunch break, the weekend or the holiday season. Some feedback names the stage directly ("At checkout…", "When it arrived…", "After six months…"). Other feedback shows it through what the customer was doing: a review about pairing a device with a phone describes setup even if the word never appears.
Feedback that gives no clue about when the experience happened gets no answer for Experience Stages. That is expected: a short review such as "Great value for the price." says nothing about the moment. The share of records that answer Experience Stages tells you how much of your feedback can be placed on the journey at all. One piece of feedback can describe several stages, for example a smooth purchase followed by a difficult setup, and each one is counted.
An experience stage comes from the text, not from a date. When the feedback was written is held in your data's Date column, and Kimola uses it for the Over time charts and for the trends of Signals. Experience Stages describes the moment the feedback talks about: a review written in March can be about the day the product was delivered in January. Experience Stages is also different from Experience Context, the Dimension next to it in the Context group: Experience Context asks "Where does this occur?" and describes the setting or situation, such as at home, in a store or on the road, while Experience Stages describes the point in time.
What You Get
Kimola builds the answers of Experience Stages from your data. It reads the dataset, finds the stages and moments the feedback describes and names each answer in their terms, so the stages behind an online furniture store and those behind a mobile banking app come out different. Across thousands of records, Kimola groups the same stage under one answer and counts the records that give it. The counts and shares come from the classification itself; an AI model writes the summaries afterwards, from numbers that are already computed.
In a Report
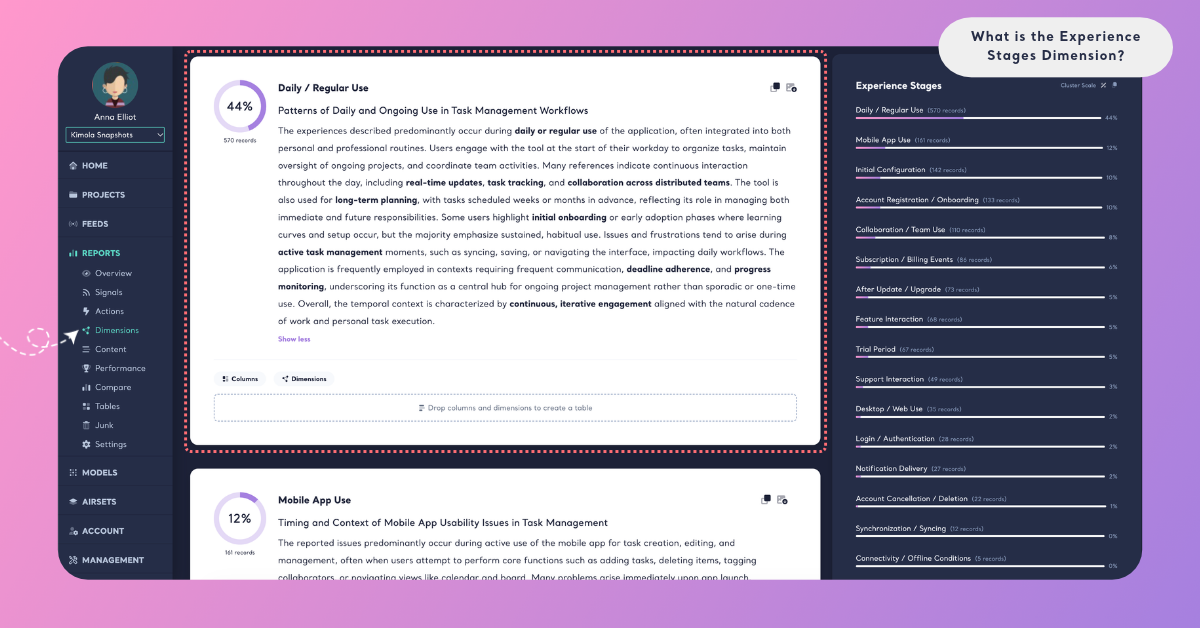
On the Report's Dimensions page, Experience Stages has its own tab. A ring shows the share of the Report's records that answer the question. The summary card gives a headline and a few paragraphs on the stages your customers write about, with key terms in bold. Below it, each stage is a cluster with its number of records, its share, a short summary. A stage with very few records gets no summary, and the page says "Summaries are not available due to small cluster sizes."
Cluster Scale shows each stage's share of the records that answer Experience Stages, and Dataset Scale shows its share of all the records in the Report. Because one record can describe several stages, the shares on Cluster Scale can add up to more than 100%. The Columns and Dimensions buttons on a cluster card show what lies behind a stage, for example the Pain Points customers report most often during setup or the channels the delivery feedback comes from. See Dimensions in Reports.
In a Space
Spaces are available in the Enterprise package. On a Space's Dimensions page, Experience Stages shows its answers under What they talk about and how they change Over time. A stage whose share changed significantly with the last upload is marked ▲ or ▼ "since the last upload", which can show customers starting to write more about delivery or about renewal. Kimola writes Insights after every new file: What the answers say for Experience Stages as a whole, and Why they answer so for each stage that at least 10 of the latest records give. In a Space, the answers come from the labels of the Funnel's Experience Stages model. See Dimensions in Spaces.
In both Reports and Spaces, you can filter the Content and Performance pages by a stage, or cross Experience Stages with a column or a classifier in Tables, for example Experience Stages by sentiment or by sales channel.
An Example
Take this invented review of a robot vacuum bought online:
"Ordering took two minutes and it arrived the next morning. Setup was the hard part: the app couldn't find my Wi-Fi until the third try. Now I run it every weekday while I'm at work, and three months in the side brush already tangles with hair."
Experience Stages finds four answers in it. "Purchase" comes from the ordering, and "Delivery" from the next-morning arrival. "Setup" comes from connecting the app, even though the review only describes what the customer was doing. "Long-term use" comes from "three months in". The Wi-Fi trouble and the tangling brush are not stages; they are answers for Pain Points. Placed on the stages, they show that this customer's problems sit at setup and after months of use, while buying and delivery went well. The home where the vacuum runs and the hours the customer spends at work are picked up by Experience Context when that Dimension is added.
A second review, "Strong suction for the price.", says nothing about when the experience happened, so it gets no Experience Stages answer.
Across a dataset of 6,000 reviews, the same stages gather into clusters. "Setup and first use" might be the largest, with 910 records, followed by "Long-term use" and "Delivery". The summary would then say that much of the feedback is written in the first days with the product, and crossing Experience Stages with sentiment in Tables would show which stage holds the most negative feedback.
The answer names and numbers here are illustrative: Kimola names the stages of your own data in your customers' words.
When to Use It
Use Experience Stages whenever you need to know at which point of the customer journey something goes well or badly. It reads best in feedback where customers tell what happened to them: product reviews, app store reviews, open-ended survey answers and support conversations. For how teams use this kind of research, see Customer Journey.
Customer journey mapping. Build the journey from what customers write instead of from a workshop. The stages Kimola finds, and how many records each holds, show which moments your customers think are worth talking about.
Locating problems. Cross Experience Stages with Pain Points in Tables to see where each problem happens. A problem that appears only at setup calls for a better guide or onboarding; one that appears after months of use points to durability or support.
Onboarding and first use. Read the first-use and setup stages on their own to see what new customers struggle with before they reach the value of the product.
Handing work to the right team. A stage often tells you who owns a problem: purchase and delivery feedback for operations, setup for product and onboarding, after-sales stages for support. Filter the Content page by a stage to read only that part of the journey.
Competitors. Create a Report from the review pages of a rival's product to see at which stage their customers are happiest or most frustrated, and compare it with your own journey.
Change over time. In a Space, follow whether a stage starts to collect more feedback after a change, such as a new delivery partner or a new setup flow.
Experience Stages works best together with the other Dimensions of the Context group. Experience Context ("Where does this occur?") adds the setting of each stage, Social Context ("With whom does this occur?") shows whether customers go through it alone or with others, and Co-Occurrences ("Alongside what does this occur?") shows the products, tools or behaviors that come with it. Outside the group, Pain Points gives each stage its problems and Personas shows who goes through it.
Use It in Kimola
How you add Experience Stages depends on whether you work in a Report or a Space.
In a Report
Select Experience Stages in the Dimensions step while you create a Report. It is listed under All and under Context. Click it to add it to My List, then check the Required Query in the Review step. To add it to a Report that is already analyzed, open the Report's Dimensions page, click the Experience Stages tab without a check mark and click Generate Now. Kimola classifies the Report's existing records with Experience Stages and writes its analysis. The steps are in Add Dimensions to a Report.
Dimensions add to the queries a Report uses: queries = rows × models × Dimensions. For what your package includes, see kimola.com/pricing.
In a Space
A Space gets Experience Stages from a Dimension model in its Funnel. In Models, click Create AI Model, choose By Prompt, click Dimension in the Purpose step and choose Experience Stages under Which dimension?. Its Question and Description are filled in, and you can fine-tune them for your business. In Labels, define the stages your Spaces can find, such as "Delivery", "Setup" or "Renewal", each with a short description. Then pick the model on the Dimensions tab of the Funnel wizard's Models step. Every file uploaded to the Funnel's Spaces after that is classified with Experience Stages. The steps are in Add Dimensions to a Funnel.
If your team already works with a customer journey map, enter its stages in Labels, so every file is read against the same journey.
Spaces are available in the Enterprise package. They are also available in Kimola On-Premises.