What is a Signal?
3 mins read - Created on Jun 03, 2026A Signal in Kimola is an insight observation automatically created from dimension analysis results. Dimensions are analytical layers that organize customer feedback into categories such as motivations, pain points, personas, unmet needs, and usage contexts. Kimola then analyzes these dimension outputs to detect recurring patterns and generate related signal observations across the dataset.
Signals help surface recurring insight patterns, behavioral relationships, and contextual observations emerging across customer experiences. Instead of manually reviewing thousands of individual comments, users can explore concise, human-readable observations generated from broader feedback patterns within the report.
Sign in to your Kimola account and go to the Dashboard Home page.
Signals are created automatically from generated dimension outputs and do not require separate manual configuration or setup. To learn how dimensions can be generated within reports, see Add Dimensions to a Report.
Signals are displayed within the Signals section of a report after dimensions are generated.
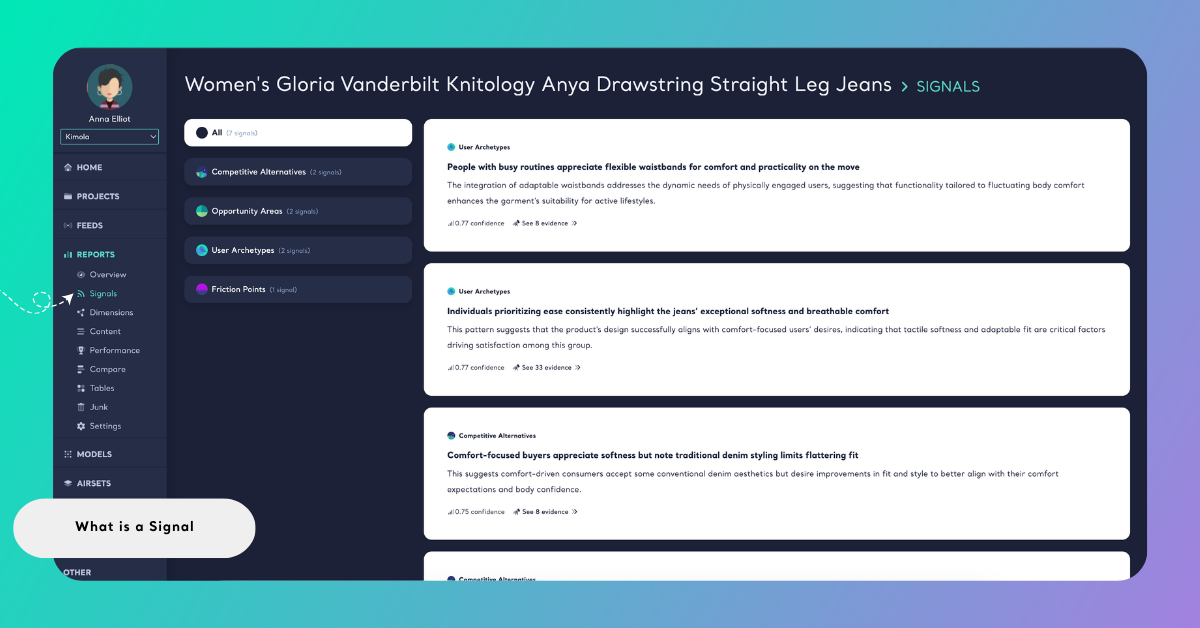
If dimensions have not been created yet, or if the dataset does not contain enough recurring patterns to generate signals, the Signals page will not appear in the report.
What Signals Provide
Signals combine related feedback patterns into broader analytical observations that help explain emerging behaviors, expectations, frustrations, and contextual relationships within customer experiences.
Each signal typically includes:
- The related signal category
- A signal title summarizing the detected observation
- A written explanation describing the insight pattern
- A confidence score indicating the strength of the detected pattern
- Supporting evidence connected to related records
Signals are grouped under related signal categories such as Product Ecosystem, Competitive Alternatives, Friction Points, Opportunity Areas, Value Drivers, Usage Context, User Archetypes, and Journey Moments depending on the dataset and detected insight patterns.
How Signals Work in Kimola
Signals work on top of existing dimension outputs within a report. Once dimensions are generated, Kimola analyzes recurring relationships and behavioral patterns across those results to identify observations that appear consistently throughout the dataset.
Signals do not modify the original dataset or replace dimensions. Instead, they function as an additional analytical layer that helps users explore broader insight patterns across customer feedback.
Why Signals Matter
Large customer feedback datasets often contain recurring patterns that are difficult to detect manually, especially when insights are distributed across multiple dimensions, customer groups, or experience contexts. Signals help surface these observations automatically and present them in a more structured and actionable format.
This makes it easier for product, marketing, customer experience, and research teams to identify emerging expectations, recurring frustrations, behavioral trends, contextual relationships, and potential opportunity areas within customer feedback data.
Because signals combine evidence, confidence scoring, and natural language explanations into a single output, they also make qualitative insights easier to communicate across teams and decision-making processes.
If dimensions identify recurring pain points around product setup, unmet needs related to ease of use, and usage context patterns connected to first-time customers, a signal may automatically reveal a broader observation such as first-time users struggling with onboarding because setup instructions are perceived as unclear in home usage environments.
This type of insight helps teams understand not only what customers are experiencing, but also how multiple behavioral and contextual patterns connect across the broader customer journey.