Performance in Reports
4 mins read - Created on Sep 22, 2025Performance is a metric in Kimola that helps you identify which themes have the greatest impact on customer satisfaction. It evaluates feedback by considering both sentiment and volume, so insights reflect not only how customers feel, but also how frequently those topics appear.
In Kimola, a report is where collected data is analyzed and presented with outputs such as sentiment, themes, summaries, and dimensions. Performance is one of these outputs and is available inside reports after analysis is completed.
This article explains what Performance is, why it matters, and how to use it inside a report.
To view the Performance output, you must be signed in to your Kimola account and have an existing report opened from the Reports section. The report must already include analyzed data, meaning that data collection and analysis have been successfully completed. Performance becomes available when analysis outputs, such as sentiment classification and theme analysis, are generated within the report.
What is Performance
Performance is an output powered by Kimola’s Satisfaction Score approach. It identifies the most positively and negatively impacting themes in your data by combining:
- Sentiment distribution (positive / negative balance)
- The number of records associated with each theme (volume)
To ensure reliable scoring, Kimola uses the Wilson Score Interval when calculating Performance results. This statistical method prevents themes with very few records from appearing artificially strong or weak, and helps surface themes that are both sentimentally meaningful and widely represented in the data.
As a result, Performance highlights themes that have a real and measurable impact on customer experience.
Why Performance Matters
Sentiment percentages alone can be misleading.
- A theme with 3 reviews that are 100% positive
- A theme with 800 reviews that are 90% positive
Although the first looks “better” by percentage, the second reflects the experience of far more customers. Performance accounts for this difference automatically.
By considering volume alongside sentiment, Performance helps you:
- Avoid over-emphasizing small sample sizes
- Focus on themes that affect large customer groups
- Identify areas that truly require attention or investment
How Performance Is Generated
Performance is generated automatically as part of the report analysis. Once the data is collected and analyzed, Kimola calculates performance scores for themes based on both sentiment distribution and review volume. This allows performance metrics to be explored without any additional setup.
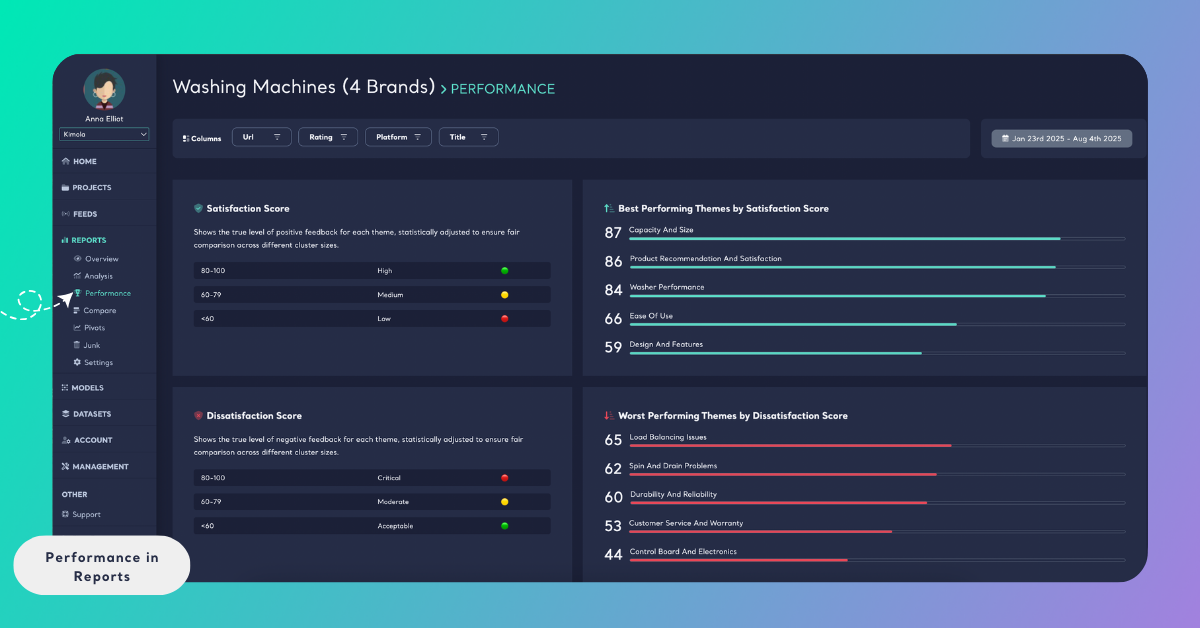
What You See in the Performance Output
The Performance view displays how different themes behave in relation to customer satisfaction and dissatisfaction within the report. Themes are shown with their calculated scores and visually grouped to help you quickly understand which topics are associated with stronger positive experiences and which ones are linked to negative feedback. Color indicators and score ranges provide additional context, making it easier to interpret the relative impact of each theme at a glance.
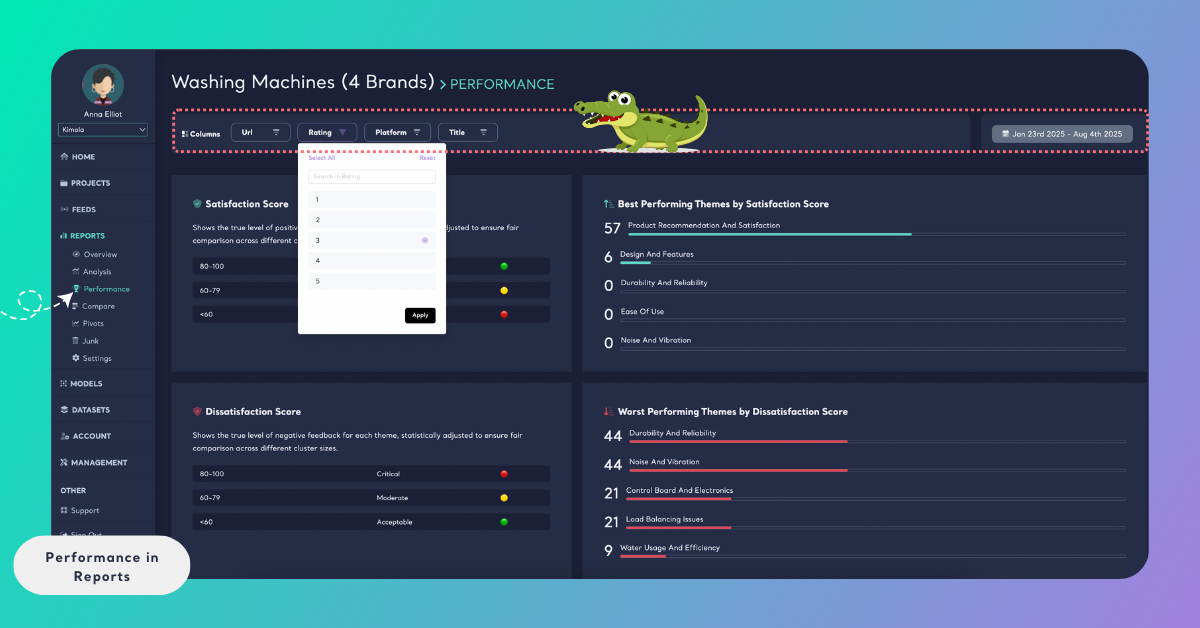
If your report includes filters such as columns or date ranges, the Performance output updates dynamically to reflect those selections. This allows you to observe how theme performance changes across different segments or over time.
When to Use Performance
Performance is most effective when you need to understand which themes truly matter to customers, not just which ones are mentioned.
It is particularly useful for:
- Identifying areas that require improvement by considering both sentiment and the number of mentions
- Highlighting strong themes worth protecting or investing in further
- Analyzing large or uneven datasets, where raw sentiment alone can be misleading
- Supporting data-driven decisions with scores that are statistically adjusted to reflect real customer impact
Performance helps you move beyond isolated feedback and focus on what matters most at scale, making it easier to prioritize actions and understand real customer impact.