Filter Records in Reports
5 mins read - Updated on Dec 22, 2025Filters help you narrow down large datasets and focus only on the records that matter for your analysis. In Kimola, a report is where collected data is analyzed and presented with insights such as sentiment, themes, and summaries. Filters allow you to refine which records are shown inside a report without changing the underlying data.
This article explains how to access report filters and how each filter type works.
Before applying filters, make sure you are signed in to your Kimola account and have opened the report you want to work with from the Reports section. Filtering options are available only in the full analysis view, so after opening the report, switch to full analysis by clicking See Full Analysis in the top-right corner or by navigating to the Analysis view using the left panel inside the report.
Available Filter Types in Reports
The set of filters available in a report is not fixed. Available filters depend on the data and analysis included in the report. Some filters appear only if the corresponding fields or analysis outputs exist.
For example, columns collected from Amazon reviews can vary by product. One product may include attributes such as color or pack size, while another may include different variation fields. As a result, the available column filters can differ from one report to another.
Similarly, the Date filter is available only if the dataset includes a date field. If no date information exists, time-based filtering is not shown. Theme and sentiment filters appear only when the related analysis or classifiers are applied during report creation.
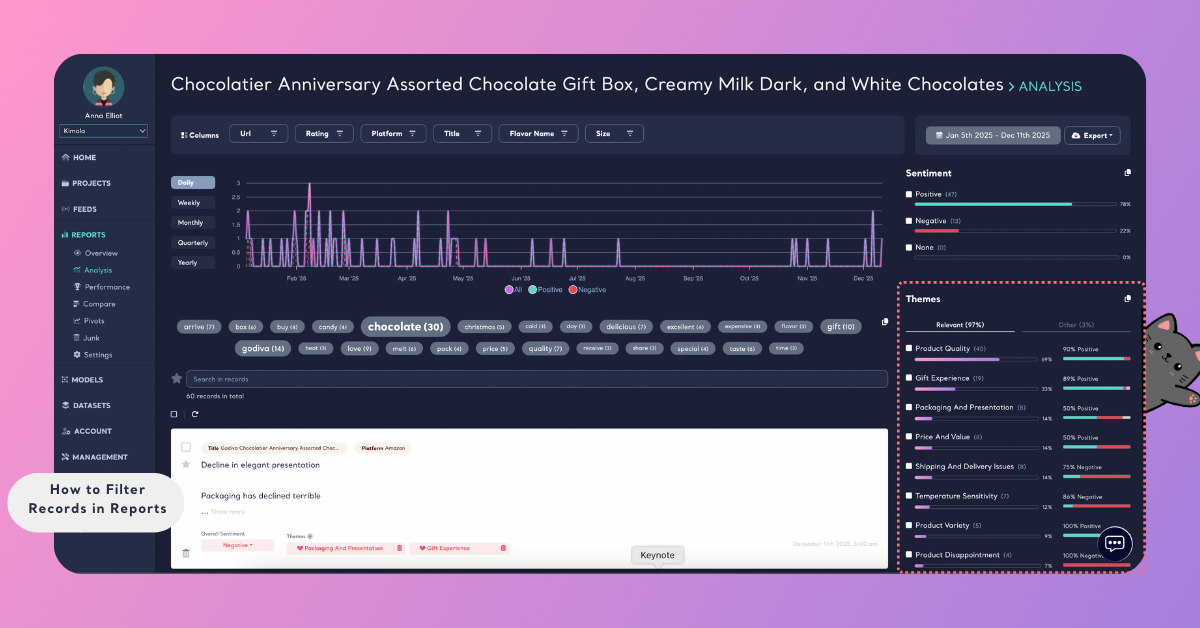
Once you are in the full analysis view, filtering controls appear above the report content. You can apply one or multiple filters at the same time to refine the data shown in the report.
In addition to exporting reports, key dashboard elements can also be copied directly.
Sentiment distributions, themes, popular terms, and language breakdowns displayed in the report dashboard can be copied and pasted into external tools such as Excel. This is useful for quick checks, ad-hoc analysis, or combining Kimola insights with existing spreadsheets without exporting the full report.
Filter by Columns
The Columns filter helps you focus on a defined subset of records by filtering based on specific data fields in your dataset.
The Columns filter allows you to narrow down records based on the data fields available in your dataset, such as rating, product variation, seller name, country, platform, or other attributes. After selecting a column, you can simply choose one or more values from that column to refine the results.
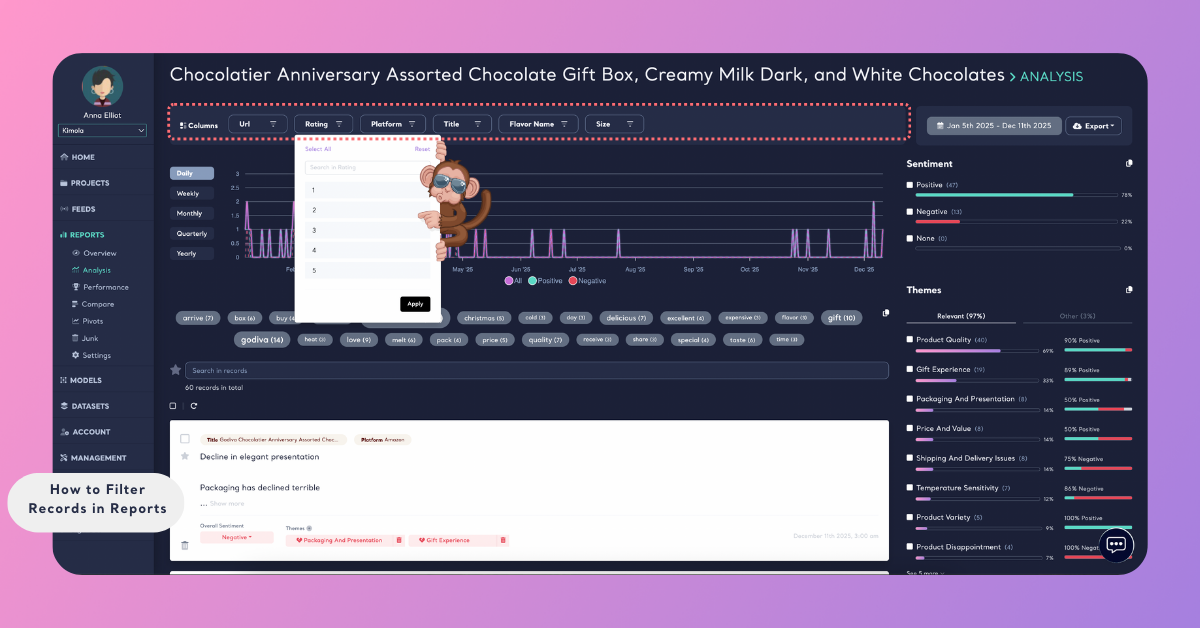
This makes it easy to focus on a specific subset of data—for example, reviewing feedback for a particular seller, analyzing reviews for a certain product variation, or filtering records from a specific country—without scanning the entire dataset.
Filter by Date
If your dataset includes a date field, you can limit records to a specific time period.
By setting a start and end date, you can analyze feedback from a particular timeframe, such as a campaign period, launch window, or seasonal range.
Filter by Popular Terms
Kimola automatically detects frequently mentioned terms in your dataset.
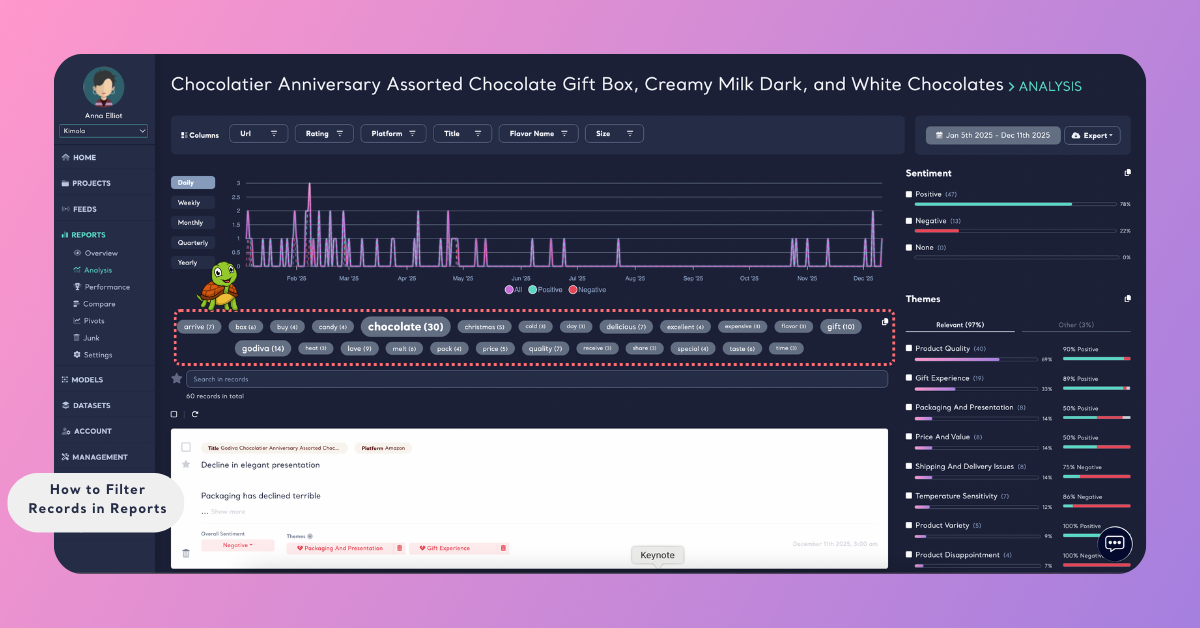
You can click on any popular term to filter the report and display only the records where that term appears. This allows you to quickly explore conversations around specific features, issues, or themes.
Filter by Keyword Search
Unlike Popular Terms, keyword search lets you manually look for specific words or phrases, even if they are not frequently mentioned across the dataset.
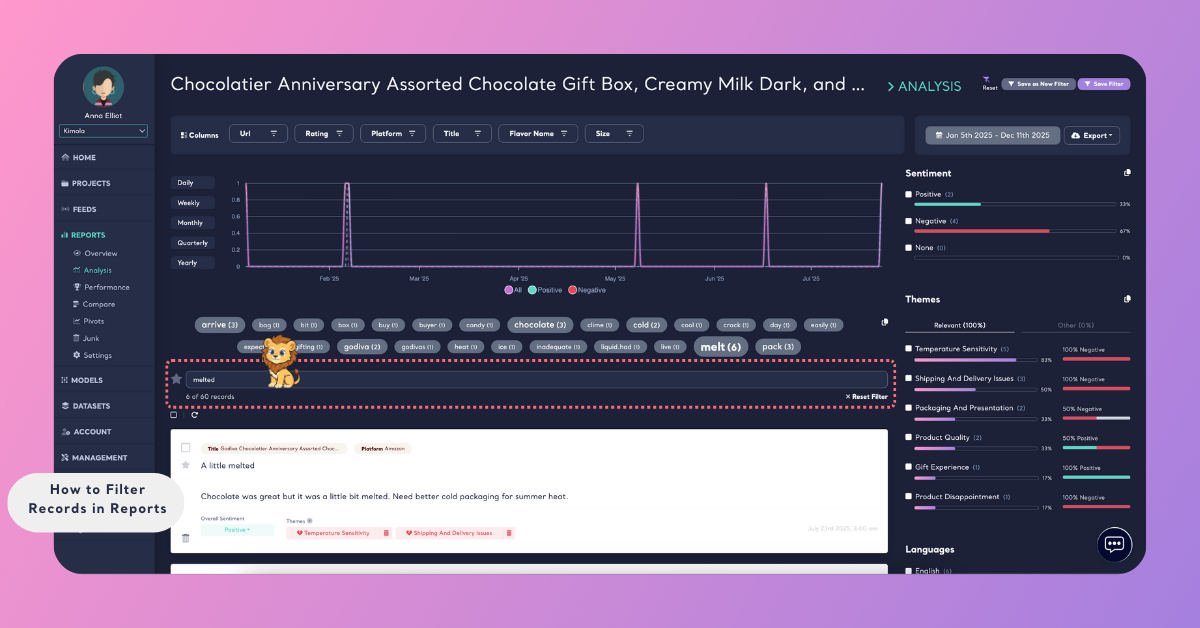
This filter is useful when you want to find records mentioning specific concepts, brand names, features, or issues that may not appear as popular terms.
Filter by Sentiment
Sentiment filters let you focus on records classified as positive, negative, or neutral.
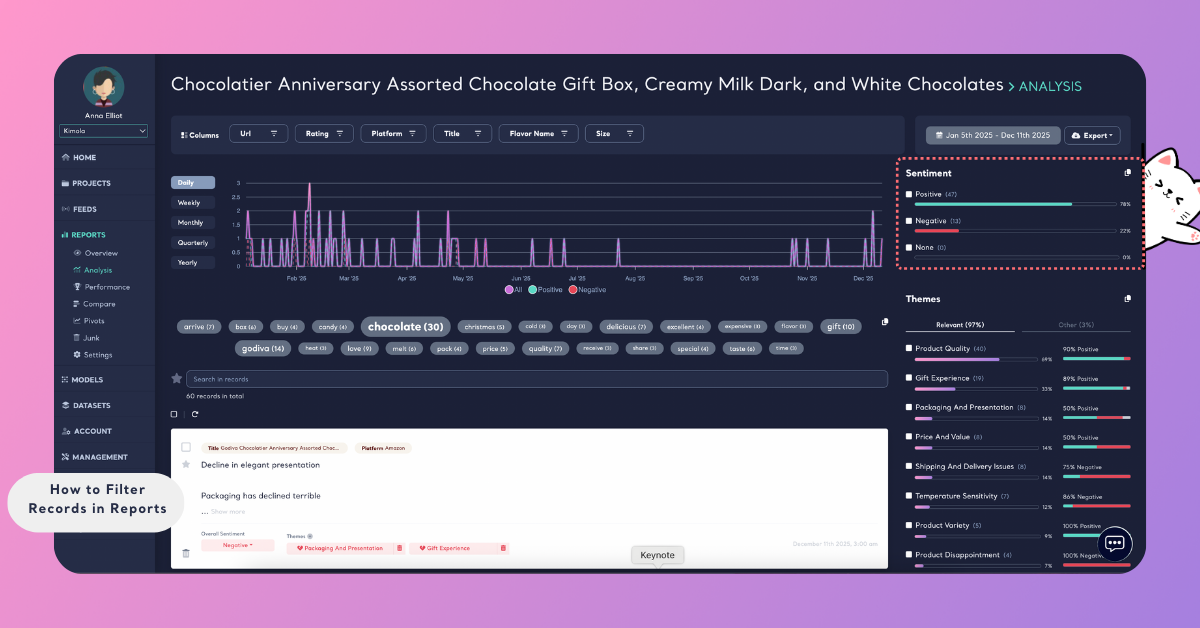
This makes it easy to isolate complaints, highlight positive feedback, or compare sentiment-driven patterns across the dataset.
Filter by Theme
Themes are generated through classification and analysis models during report creation. If your report includes theme analysis, you can filter records by these labels.
This helps you focus on specific discussion areas, such as usability, pricing, customer support, or product quality, depending on the applied classifiers.
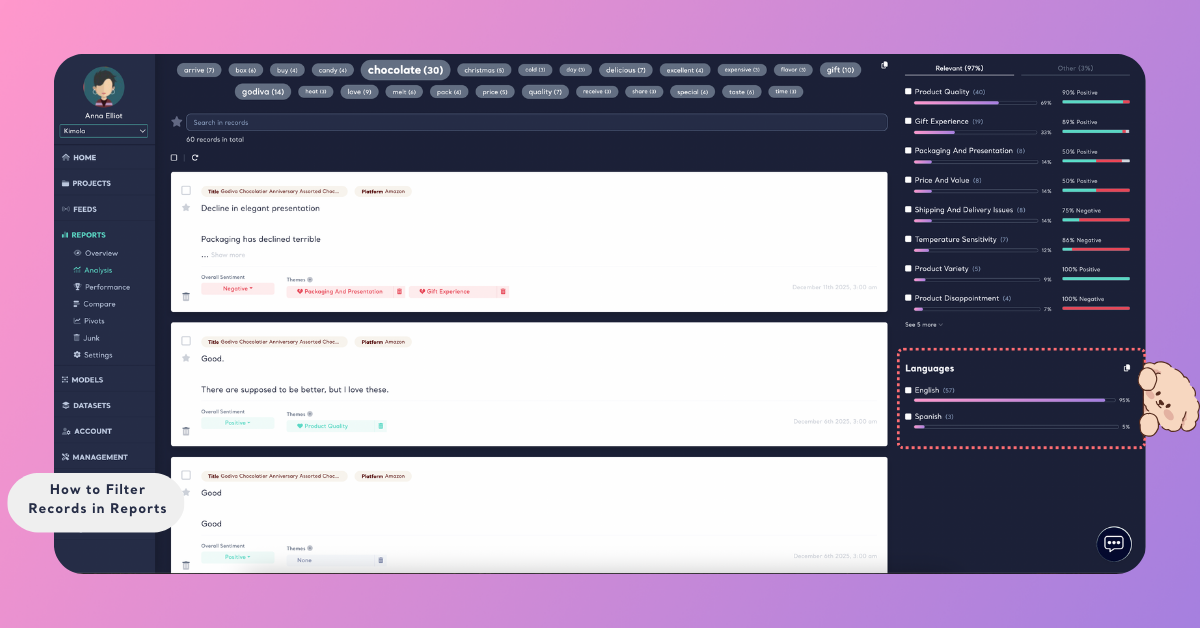
Filter by Language
Language filters allow you to narrow down records based on the language detected in the content.
This filter is especially useful when working with multilingual datasets, such as global Amazon reviews or feedback collected from multiple regions. It helps you focus on insights from a specific market or analyze languages separately for clearer interpretation.
Applying filters does not modify or remove data from the report. Filters only change which records are displayed.
When working with multiple filters, you may want to return to the original, unfiltered view of the report. To remove all applied filters at once, use the Reset option in the top-right corner of the page. You can also clear all active filters using the Reset Filters option located below the search bar. Both options restore the report to its default, unfiltered state.
You can export reports with filters applied. After setting your desired filters, use the export option and choose whether to apply current filters or export the full dataset. Filtered exports are supported for Excel, PDF, and PowerPoint formats.
By combining different filter types, you can create focused views of your data that align with specific analysis goals. Filters help you move from broad datasets to targeted insights, making it easier to explore patterns, validate assumptions, and extract meaningful conclusions from your reports.