Compare Feature on Reports
5 mins read - Created on Aug 12, 2025The Compare feature helps you analyze differences and similarities between specific segments of your report data. In Kimola, a report is where your collected dataset is analyzed and presented with structured outputs such as sentiment, themes, and summaries. Instead of reviewing these insights in isolation, Compare lets you view the same analysis results side by side within a single report.
This article explains what the Compare feature does, when to use it, and how to create meaningful comparisons step by step.
Before using the Compare feature, make sure you are signed in to your Kimola account and have opened the Reports section from the left menu. Compare is available only inside reports, so you need to select and open an existing report first. The report must already include analysis results, such as sentiment or theme analysis, and it should contain either dataset columns or previously saved filters. Once these conditions are met, click the Compare page from the left menu.
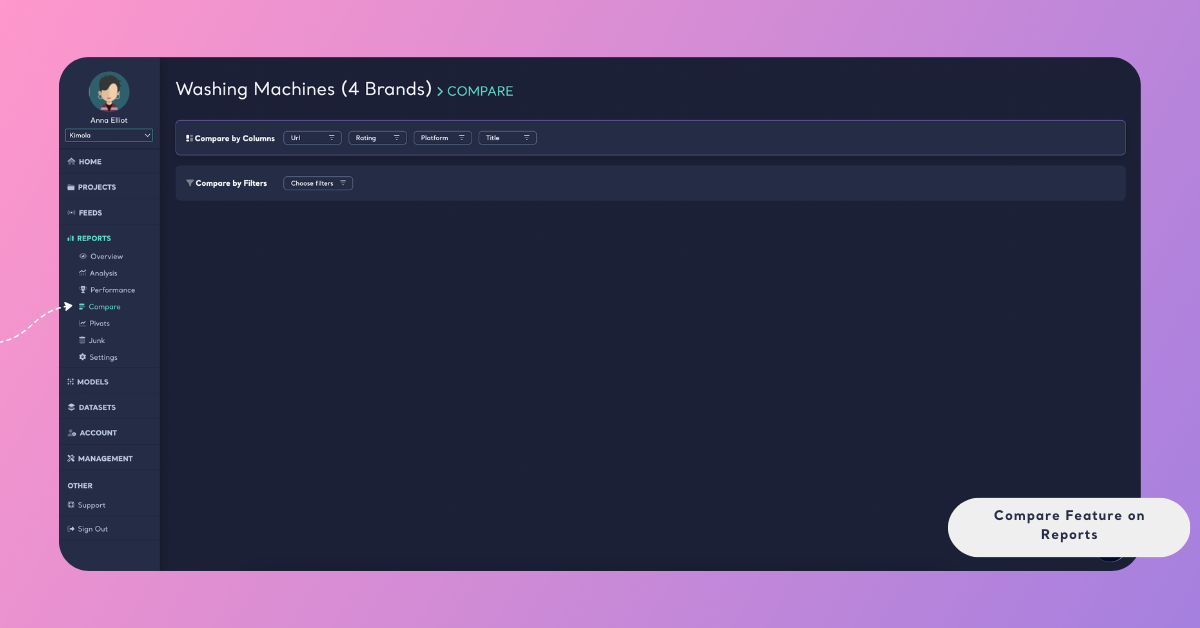
What You Can Compare
Once you open the Compare page inside a report, you can create comparisons based on one source type at a time. This ensures that all compared segments use the same logic and remain consistent.
You can compare data using:
- Dataset columns included in the report
- Saved filters created from the Analysis view
You cannot mix columns and saved filters in the same comparison.
You can compare up to five items at the same time in the Compare view.
1. Compare Dataset Columns
Dataset columns come from the data used to create the report. These may include fields such as product name, rating, country, seller, platform, or other attributes depending on the data source.
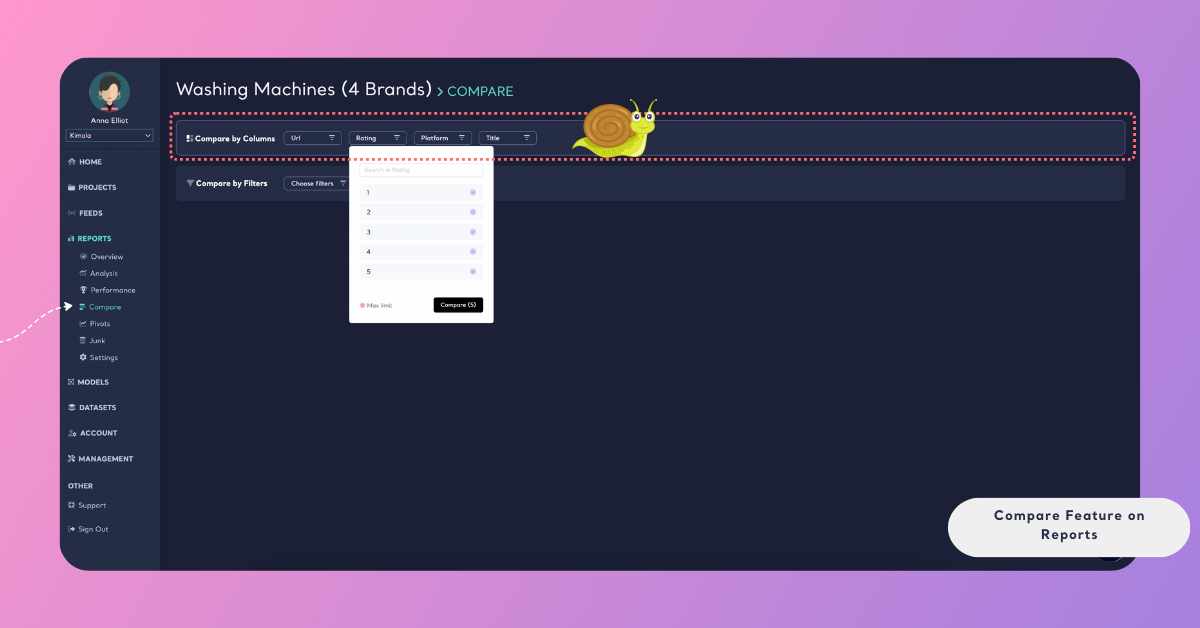
When you select a column, you can choose specific values within that column to compare. For example, you might compare:
- Different products within the same report
- Ratings such as 1-star vs 5-star reviews
- Feedback from different countries or platforms
Each selected value becomes a separate comparison item, displayed side by side.
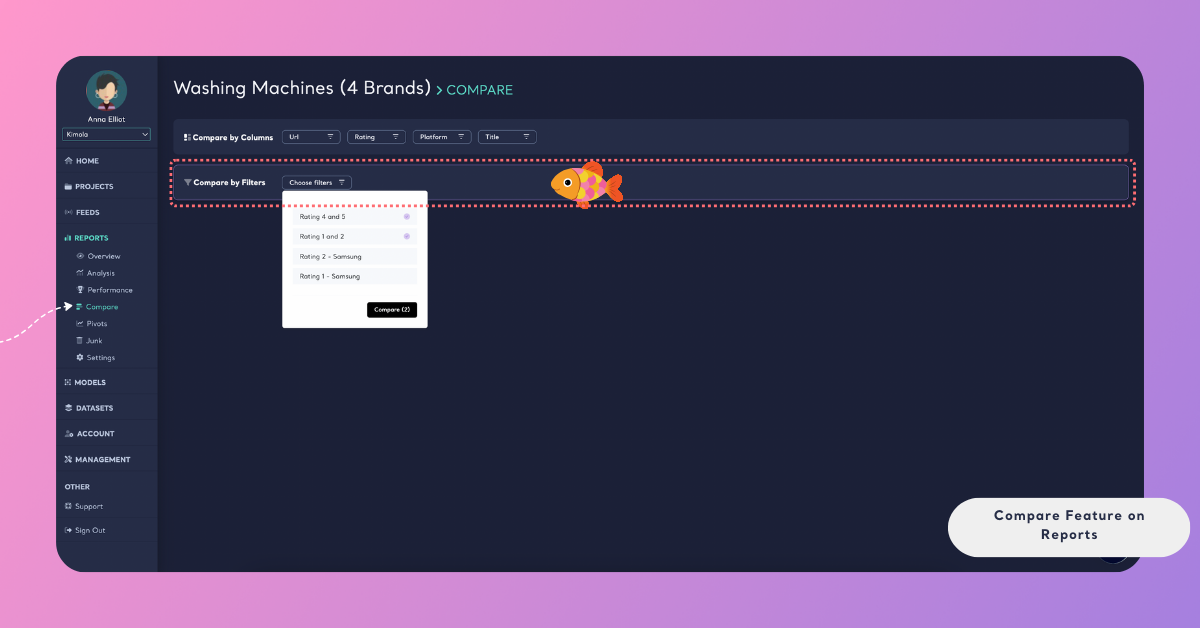
2. Compare Saved Filters
If you have saved filters in the report, you can use them directly in the Compare view.
Saved filters represent predefined data segments created using one or more filtering criteria (such as rating, sentiment, theme, or language). Comparing saved filters allows you to analyze different segments using the exact same filtering logic, without recreating filters manually.
If you’re not familiar with saving filters yet, see Save Filters in Reports to learn how to create and manage saved filter views.
This is especially useful when comparing:
- Different rating groups
- Different product segments
- Filtered views created at different times
How the Comparison Is Displayed
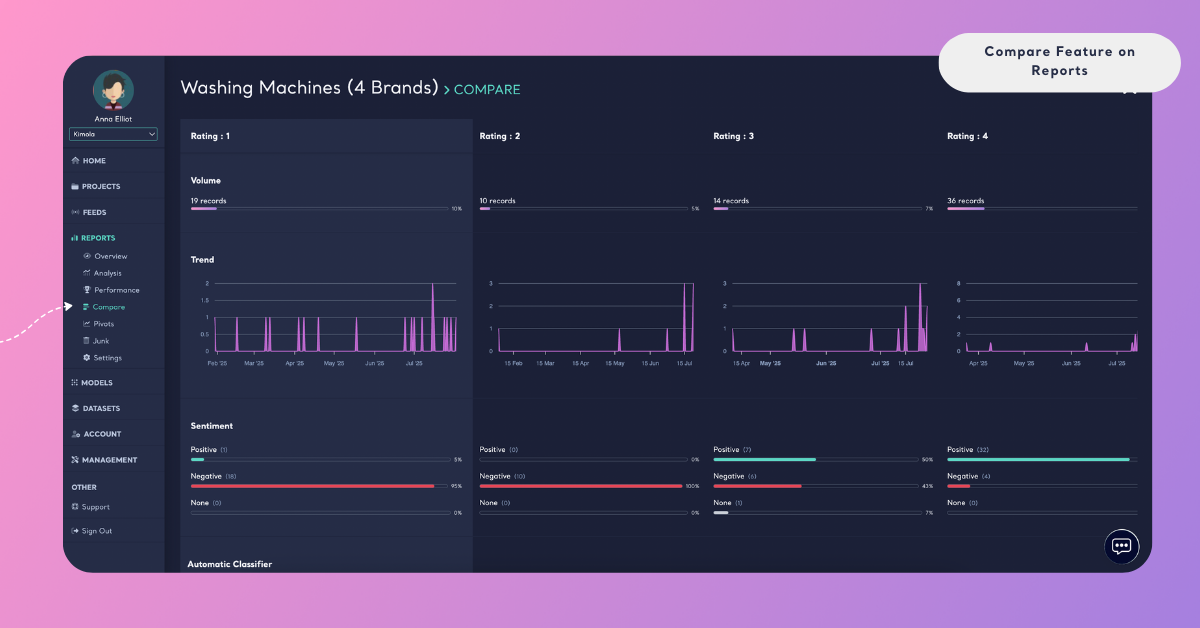
The Compare view displays selected segments side by side using the same analytical structure and metrics. This allows you to evaluate differences and similarities across datasets, filters, or groups in a consistent way.
Depending on the analyses included in the report, the comparison may include several types of results.
At the top of the comparison, you can review record volume and sentiment distribution for each selected segment. Record volume shows how many records are included in each segment, while sentiment distribution displays how positive, negative, or neutral feedback is distributed across them. These metrics help you quickly understand scale and overall sentiment differences before moving into deeper analysis.
Below these high-level metrics, the comparison continues with theme-level results. Themes represent the topics identified in the data, and they are displayed for each segment with their corresponding sentiment performance. When the same theme exists across multiple segments, you can compare how its sentiment and presence differ side by side.
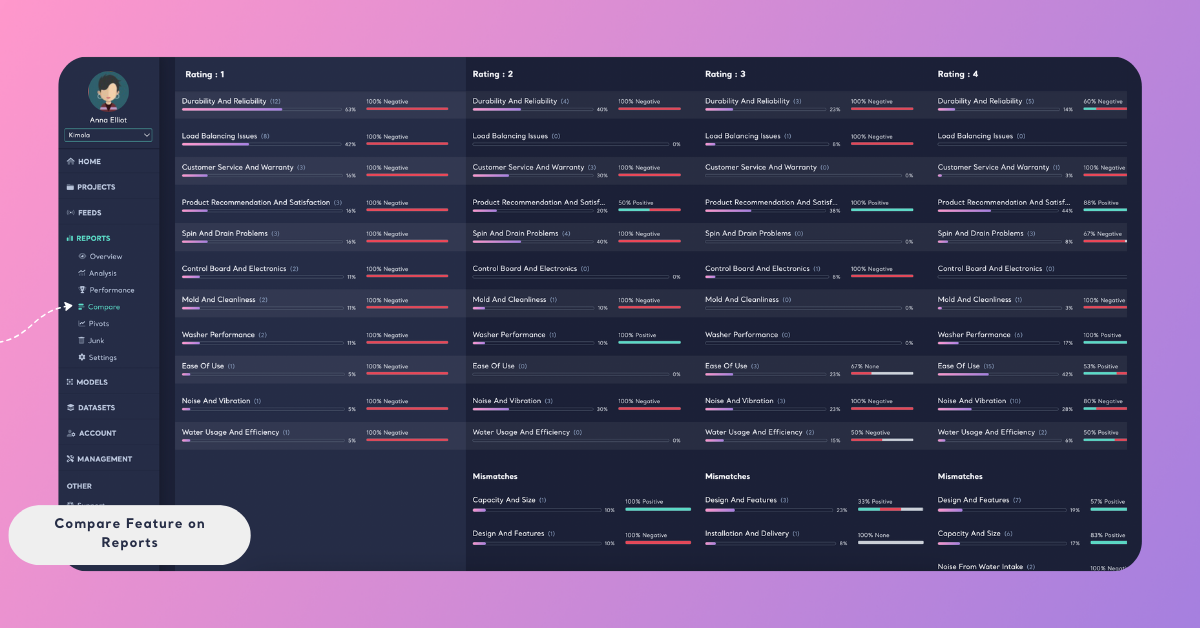
In addition to shared themes, the comparison may also surface mismatches. Mismatches indicate themes that appear in one segment but not in others. These differences can highlight issues, discussion areas, or strengths that are unique to a specific rating group, product, time period, or applied filter.
The comparison view may also include popular terms and language distribution, depending on the analyses enabled in the report. Popular terms show frequently mentioned words or phrases within each segment, while language distribution provides insight into the languages present in the data.
You can scroll horizontally to review each selected segment in parallel. The first item you select appears on the left side of the comparison view, and additional items are displayed to the right in the order they were selected.
The first item you select appears on the left side of the comparison table. Additional items appear to the right.
What Compare Does (and Does Not Do)
Compare works only with existing analysis results. It does not:
- Create a new report
- Re-run scraping or analysis
- Consume additional queries
All comparisons are generated instantly based on the data and analysis already available in the report.
When to Use Compare
The Compare feature is best used when you want to:
- Identify differences between multiple products, brands, or segments
- Understand how sentiment or themes vary across groups
- Validate insights using consistent criteria
- Review multiple perspectives without switching between views
Instead of analyzing segments one by one, Compare brings them together in a single, unified view.
By using Compare, you can move beyond isolated insights and gain a clearer understanding of how different parts of your data relate to each other—making your analysis more structured, consistent, and actionable.