Export a Report as Excel File
4 mins read - Created on Feb 20, 2025Exporting a report as an Excel file allows you to work with your analysis results outside Kimola. Excel exports are commonly used for deeper analysis, internal sharing, custom reporting, or combining Kimola outputs with other data sources.
This article explains how to export a report as an Excel file and what to expect from the exported output.
Sign in to your Kimola account and open the Reports section from the left menu.
Step 1: Open the Report
From the Reports page, locate the report you want to export and open it by clicking its name or the View button.

You can also export a report without opening it. On the Reports page, click the arrow next to View and select Excel to download the report directly.
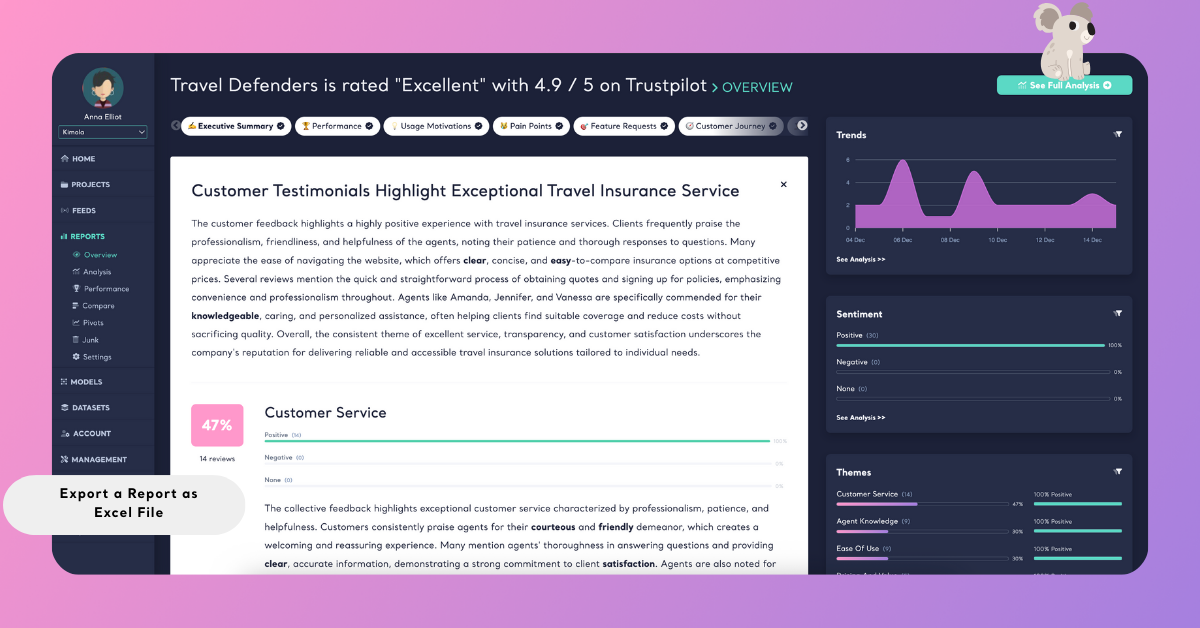
Step 2: Access the Full Analysis View
To export detailed analysis outputs, make sure you are viewing the full analysis.
Click See Full Analysis in the top-right corner of the report, or use the report navigation on the left panel to open the analysis view.
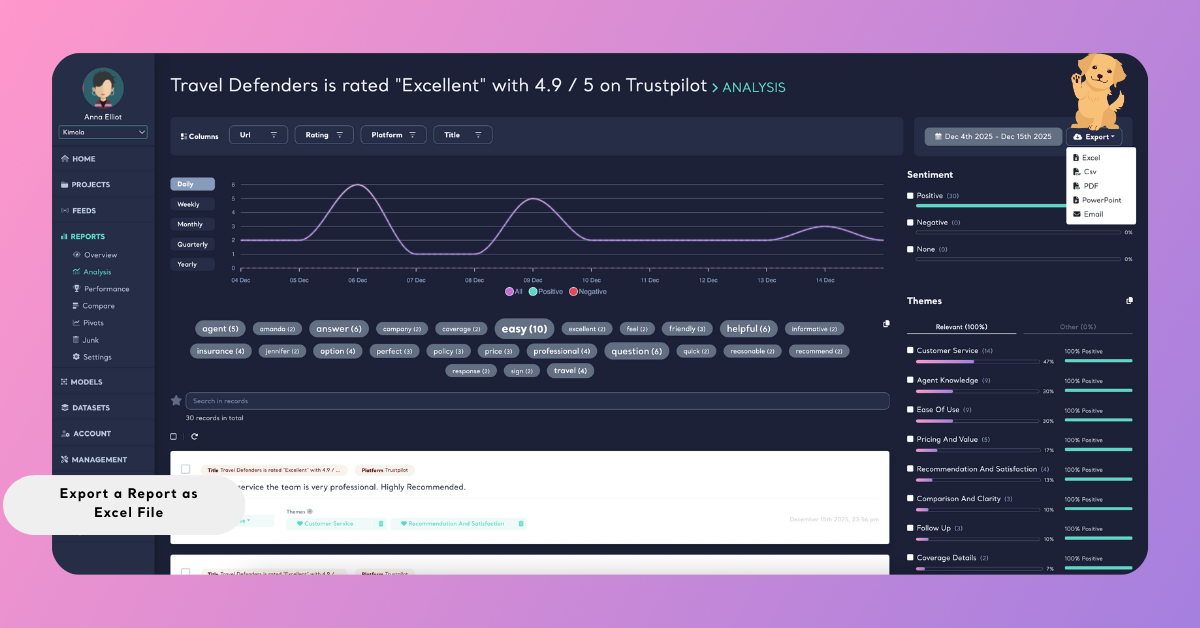
Step 3: Export the Report
In the analysis view, click the Export button at the top-right corner.
From the export options, select Excel. Kimola will prepare the file based on your report’s current state.
Step 4: Export With or Without Filter (Optional)
If filters such as date range, platform, or keywords are applied, Kimola lets you choose how the export should behave:
- Apply current filters exports only the filtered data currently visible
- Download without filters exports the complete dataset used in the report
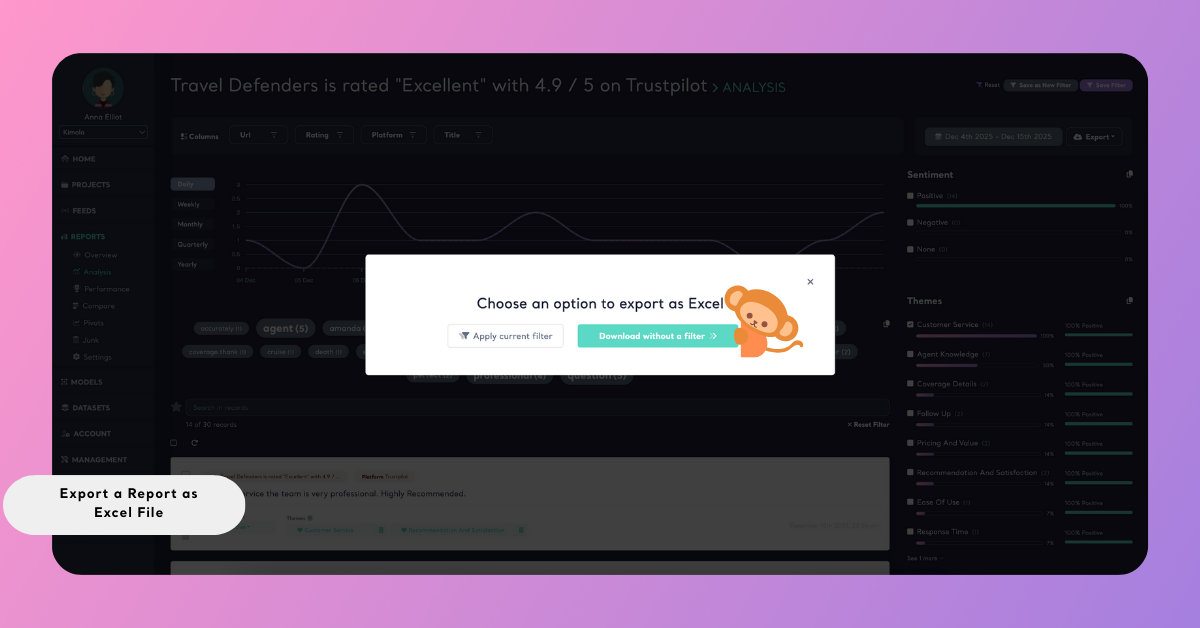
Select the option that matches your use case before downloading.
Step 5: Download and Open the File
Once processing is complete, the Excel file will be downloaded to your computer. You can open it using Microsoft Excel or any compatible spreadsheet application.
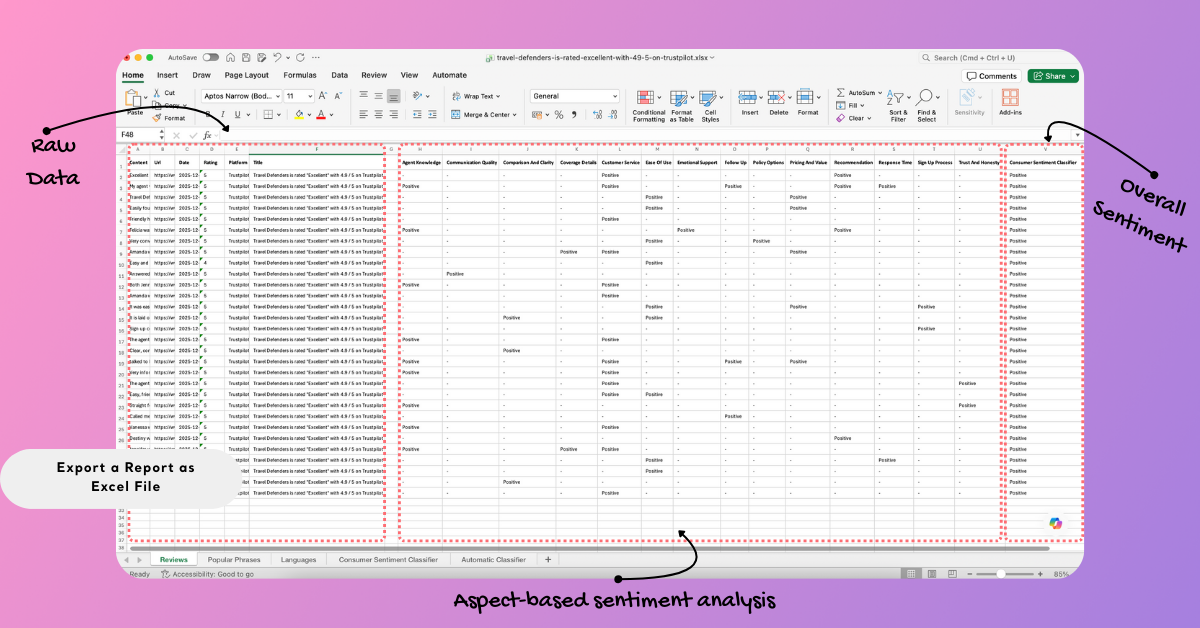
What’s Included in the Exported Excel File
When you export a report as an Excel file, Kimola generates a structured workbook that separates different analysis outputs into dedicated sheets for easier review and analysis.
The Reviews sheet contains the full record-level data used in the report. This includes the original content (such as reviews or comments), source URL, date, rating (if available), platform name, and title. Depending on the platform and classifiers used in the report, this sheet may also include additional columns such as product or seller details, service attributes (for example customer service or ease of use), and classification results. Sentiment outputs like Positive, Negative, or None are shown at record level, allowing you to analyze individual entries in detail.
The export also includes a sheet that highlights popular phrases extracted from the dataset. This section lists frequently mentioned terms along with their usage count and percentage, helping you quickly identify recurring topics and commonly used language across the data.
For multilingual datasets, a language distribution sheet is included. This sheet shows which languages appear in the dataset, together with record counts and percentages, making it easier to understand the linguistic makeup of your data.
Sentiment analysis results are summarized in dedicated sheets as well. One sheet presents the overall consumer sentiment distribution, showing how many records are classified as positive, negative, or neutral and their corresponding percentages. Another sheet includes automatic classifier results, where sentiment performance is broken down by category or label, with counts and percentage-based distributions.
Together, these sheets provide both detailed, record-level data and high-level summaries in a single Excel file. This structure allows you to work with raw content, review classification outputs, and perform further analysis or reporting directly in Excel without losing the context of the original data.
By exporting reports as Excel files, you can easily extend your analysis beyond Kimola, collaborate with others, and reuse structured insights in your existing workflows. Excel exports ensure your data remains accessible, flexible, and ready for further analysis or reporting whenever you need it.