Turn open-ended survey responses
into research findings
Turn open-ended survey responses into research findings: themes, sentiment, motivations and pain points, compared across any segment in your data.















3,000+ teams in more than 90 countries use Kimola.
Upload and Analyze Survey Responses
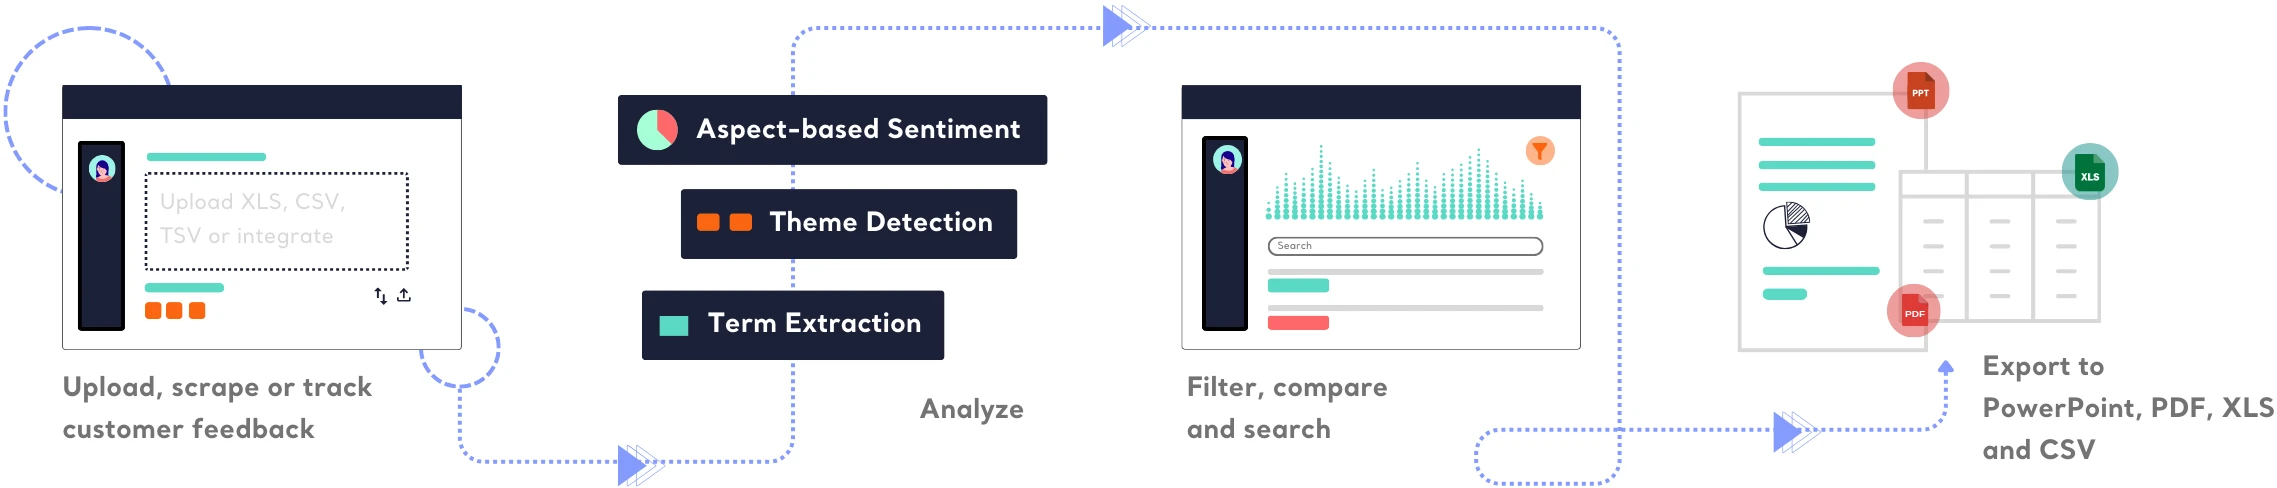
Upload survey responses from Excel, CSV, TSV, or connect platforms like Google Sheets and Zendesk. Kimola automatically maps text data, allowing you to filter responses based on any column—such as customer type, location, or product category.

Sentiment and Themes with Aspect-Based Accuracy
Kimola assigns sentiment for each theme in a single survey response, ensuring you capture every detail —what responders like, dislike, and why. Even when a responder mentions different topics within the same review, Kimola successfully breaks down feedback into multiple aspects and accurately assigns sentiment to each, so mixed feedback is not reduced to a single score.
Learn about Aspect-based Sentiment Analysis
Kimola's Dynamic Classification™ technology understands context and generates relevant theme clusters without relying on pre-defined categories. It adapts to any dataset, eliminating the need for manual labeling or data annotation. This keeps categories close to what people actually say, instead of forcing feedback into a predefined list.

Analyze feedback in 30+ languages
Kimola analyzes 30+ languages, making it easy for international teams to analyze open-ended survey results in multiple languages without separate processing.
Reports can be generated in English, Spanish, French, German, and more—helping companies with diverse audience understand motivations and behaviours across different regions.

Summaries, Pain Points, Motivations and more
Kimola analyzes large-scale survey responses and generates structured executive summaries around key topics and themes. Unlike generic AI-generated text, Kimola offers summaries with sub-sections and with sentiment and content classifications, which provides clarity, focus, and actionable insights.
Learn more about Executive Summary
Kimola analyzes survey responses to reveal the motivation and behaviours of responders in any topic. AI-driven analysis detects patterns across any number of survey responses, highlighting key motivations, recurring pain points, and competitive advantages.
Kimola analyzes customer feedback through a four-stage journey framework—Discovery, Purchase Experience, Usage & Support, and Loyalty & Advocacy. By applying its proprietary scoring algorithm, Kimola classifies feedback into these stages to reveal how customers perceive each step, measure satisfaction levels, and pinpoint the critical moments that define brand relationships.

Stay Updated with Critical Insights in Your Inbox
Once your open-ended survey analysis is complete, Kimola sends an email summary highlighting the most critical insights—so every important detail remains safe and accessible directly from your inbox.
These reports provide a structured breakdown of key topics, sentiment trends, and recurring themes, ensuring related teams and decision-makers can quickly grasp what matters without manually sifting through raw data.

Compare Segments Without Building Cross-Tabs
Signals use the columns in your survey data, such as customer type, location, plan or product, to show where answers differ from one segment to another and, when dates are available, how they change over time. Action Plans then turn those differences into recommendations backed by respondents’ own words.
Bring the feedback you already have.
Organize feedback like a research team.
See the people behind the feedback.


See how teams turn different kinds of feedback into research.






Frequently Asked Questions
About Survey Analysis
-
What is Survey Analysis?
Survey analysis is the process of examining survey responses to uncover patterns, sentiments, and key insights. In open-ended surveys, where respondents provide free-text answers, AI-powered tools like Kimola help categorize responses, detect themes, and extract meaningful insights without manual effort.
-
Why is Survey Analysis Important?
Survey analysis helps businesses understand customer experiences, expectations, and pain points. By analyzing responses at scale, organizations can make data-driven decisions, improve products or services, and enhance customer satisfaction.
-
How does Kimola analyze open-ended survey responses?
Kimola uses Dynamic Classification™ to automatically detect themes and group responses into meaningful categories. Additionally, its Aspect-Based Sentiment Analysis assigns positive, negative, or neutral sentiment to each detected theme—ensuring no insight is overlooked.
-
Does Kimola require manual tagging or training?
No. Kimola eliminates the need for manual tagging or predefined categories. It automatically detects themes and structures data, saving time and reducing human error.
-
Can Kimola analyze surveys in multiple languages?
Yes. Kimola supports 30+ languages, allowing teams to analyze survey responses from international audiences without translation. Reports can be generated in multiple languages, ensuring global accessibility.
Turn customer feedback into structured market research in 30+ languages—no AI training needed.
Create a Free Account No credit card · No commitment