USE CASE
Net Promoter Score
Measure customer loyalty with Net Promoter Score by analyzing customer intention using a sentiment analysis tool.
Classify social data to calculate NPS value.
Measure customer loyalty with Net Promoter Score by analyzing customer intention using a sentiment analysis tool.
Classify social data to calculate NPS value.
Net Promoter Score (NPS) is a metric for measuring customer loyalty which defines how likely a customer is to recommend a product or service to others. It is calculated by analyzing a survey of customers' attitudes and reported with a number from -100 to +100.
It was developed by Fred Reichheld and is widely used by businesses to measure customer satisfaction and the success of marketing efforts. It is based on a single question in a survey: "How likely is it that you would recommend our company/product to a friend or colleague?".
Net Promoter Score (NPS) is a popular customer satisfaction metric that measures the willingness of a customer to recommend a product or service to others. It is one of the top ten most influential metrics in the field of Customer Relationship Management (CRM). It has been used extensively by organizations to evaluate and monitor customer loyalty.
The Net Promoter Score was developed by Fred Reichheld, a marketing professor at the University of Wisconsin–Madison. Reichheld began working on the metric in 1993, and the Net Promoter Score was launched in 1996. Although NPS has been criticized for being too focused on the customer's intention rather than the customer's behaviour, it is an easy-to-understand marketing metric which can be calculated from a simple one-question survey.
 important?")
Net Net Promoter Score (NPS) is a simple one-question survey which asks customers if they would recommend a product or service to a friend or colleague. Here is an example of an NPS survey question;
"I would recommend [product/service name] to a friend or colleague."
Participants give a rating between 0 (not at all likely) and 10 (extremely likely). The survey results are broken down into three segments;
The NPS is calculated using the percentage of Promoters, Passive and Detractors. For example, if 20% of respondents are detractors, 35% are passives, and 55% are promoters, the NPS score will be 55-20 = 35. Remember that always a higher score is desirable between -100 to +100.
Even though preparing an NPS survey and calculating an NPS value is easy, surveys might not be an option in some cases. Especially when asking survey questions to customers is impossible, conventional methods are not applicable to calculate NPS. These scenarios require social data and sentiment analysis using deep NLP (Natural Language Processing) techniques to calculate NPS without asking questions to consumers.
Social listening tools can track conversations around a product, service or brand from e-commerce sites, social networks, forums, blogs, and news sites. Some of these conversations will have positive and negative sentiments, and some will contain data that can not be classified as positive or negative. This stage is where an in-depth NLP (Natural Language Processing) technology comes in to identify conversations if they are subject to sentiment analysis. These classifications will turn into Promoters, Passive and Detractors as follows;
So, the calculation of the percentage of Promoters, Passive and Detractors will enable us to apply the conventional NPS formula. For example, if 35% of respondents are detractors (post, comment or review with a negative sentiment), 45% are passives (neither positive nor negative), and 20% are promoters, the NPS score will be 20-35 = -15.
Keep in mind that people tend to share negative reviews for a product or service because of the nature of social data. So always compare the NPS score with the industrial benchmarks.
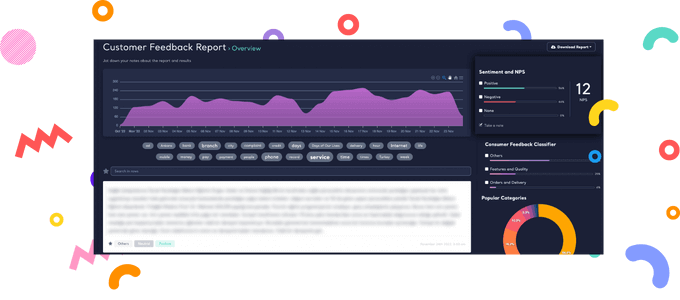
Kimola offers a rock-solid Sentiment Analysis Tool to automatically classify social data gathered from e-commerce sites, social networks, forums, blogs, and news sites. It's designed for marketers, strategists and researchers.
Upload your dataset file contains posts, comments or reviews scraped from the web.
Enjoy Kimola's beautifully designed dashboard to browse, filter and search in social data.
Net Promoter Score (NPS) is reported from -100 to +100, and a higher score is always desirable. On the other hand, evaluating an NPS value is much more meaningful compared to industry benchmarks. Today, various companies in various industries use the Net Promoter Score, there for it's much easier to find local benchmarks. Here are examples for the United States market;
Automotive companies use the Net Promoter Score to measure customer satisfaction and the success of marketing efforts. In 2012, a survey of 3000 car buyers in the United States found that 75% of respondents said they were "extremely likely" to recommend a car brand to a friend or colleague.
The banking industry is one of the top industries that use the Net Promoter Score to measure customer satisfaction and the success of marketing efforts. In 2013, a survey of 3000 bank customers in the United States found that 81% of respondents said they were "extremely likely" to recommend a bank to a friend or colleague.
The Net Promoter Score is used by retailers to measure customer satisfaction and the success of marketing efforts. In 2013, a survey of 3000 U.S. retail customers found that 81% of respondents said they were "extremely likely" to recommend a retailer to a friend or colleague.
Hospitality companies use the Net Promoter Score to measure customer satisfaction and the success of marketing efforts. In 2013, a survey of 3000 hotel customers in the United States found that 75% of respondents said they were "extremely likely" to recommend a hotel to a friend or colleague.
Healthcare companies use the Net Promoter Score to measure customer satisfaction and the success of marketing efforts. In 2013, a survey of 3000 healthcare customers in the United States found that 75% of respondents said they were "extremely likely" to recommend a healthcare provider to a friend or colleague.
Measuring customer loyalty refers to using customer satisfaction surveys, questionnaires, and other research techniques to gather data about the level of loyalty of customers to a particular product or service.
Other than the Net Promoter Score (NPS), there are two main ways of measuring customer loyalty.
The Loyalty Index is based on a survey that asks customers to rank their preferences for several products or services. It is expressed as a percentage of the total market share. The survey should be carefully designed so that customers can express a preference for a particular product or company.
For example, a loyalty index for a particular product can be calculated by asking customers which of the following products or companies they would choose if they had to choose just one;
The percentage of customers who choose Product A is the loyalty index for Product A. The index for Product B is the percentage of customers who choose Product B, and so on.
The loyalty index for all products or services together is 100%. Each product or service index will add up to 100%. For example, if Product A has a loyalty index of 50%, Product B has an index of 30%, and Product C has an index of 20%, the index for all products is 100%.
The loyalty index can be used to compare the level of loyalty for different products or companies. A loyalty index of 80% or higher is generally considered a good score.
The Loyalty Formula is based on the assumption that the level of customer loyalty can be calculated by measuring the average number of purchases made by a customer during a given period. The formula is expressed as a percentage of the total market share.
For example, a loyalty index for a particular product can be calculated by asking customers how many units of that product they have purchased in the last year. The number of units purchased can be expressed as a percentage of the total number of units sold in the last year, and the index for all products or companies together is 100%.
The loyalty formula can be used to compare the level of loyalty for different products or companies. A loyalty index of 80% or higher is generally considered a good score.

Join 3,000+ growth-obsessed teams
from 90+ countries.