Pivot Tables in Reports
5 mins read - Created on Feb 26, 2025Pivot tables allow you to summarize, compare, and explore report data from different perspectives without exporting it outside Kimola. They help you break down large datasets into structured views by combining metrics such as volume and sentiment with different data dimensions.
In Kimola, a report is where collected data is analyzed after data collection is completed. Pivot tables work directly on this analyzed report data, which means you can interactively explore insights using existing analysis outputs—such as sentiment and filters—without creating a new report or re-running analysis.
This article explains what pivot tables are, how to access them in a report, and how to use filters and metrics together to explore your data.
Pivot tables can be created inside reports. After signing in to your Kimola account, go to Reports, open the report you want to work with, and navigate to the Pivots section from the left panel.
What Are Pivot Tables Used For?
Pivot tables in Kimola work in a similar way to pivot tables in Excel.
They allow you to group, summarize, and compare report data by placing one attribute against another and viewing aggregated metrics such as volume and sentiment.
Instead of reviewing individual records, pivot tables show summarized results that help you quickly understand how feedback changes across different dimensions.
You can use pivot tables to:
- Compare volume and sentiment across products, themes, or other attributes
- See how a specific theme performs for different products
- Analyze how volume and sentiment change over time using date ranges
- Create structured, Excel-like summaries directly inside the Kimola interface
In short, pivot tables help you move from raw records to high-level comparisons, much like you would with a pivot table in Excel—without exporting the data.
When to Use Pivot Tables
Use pivot tables when you want to summarize patterns, not read individual feedback. Pivot tables are especially useful when:
- You want to compare multiple segments using the same metrics
- You need to analyze volume and sentiment across different attributes
- You are working with large datasets where raw record-level views are hard to interpret
- You want to understand how themes or topics differ across products, time periods, or other dimensions
They are ideal for moving from individual records to structured, comparative insights.
If you haven’t created a report in Kimola yet, you’ll need to create one before using pivot tables. Reports are required to analyze data and access features such as pivots, filters, and comparisons.
You can create a report in two ways:
These articles walk you through each method step by step and help you get started quickly.
Create a Pivot Table
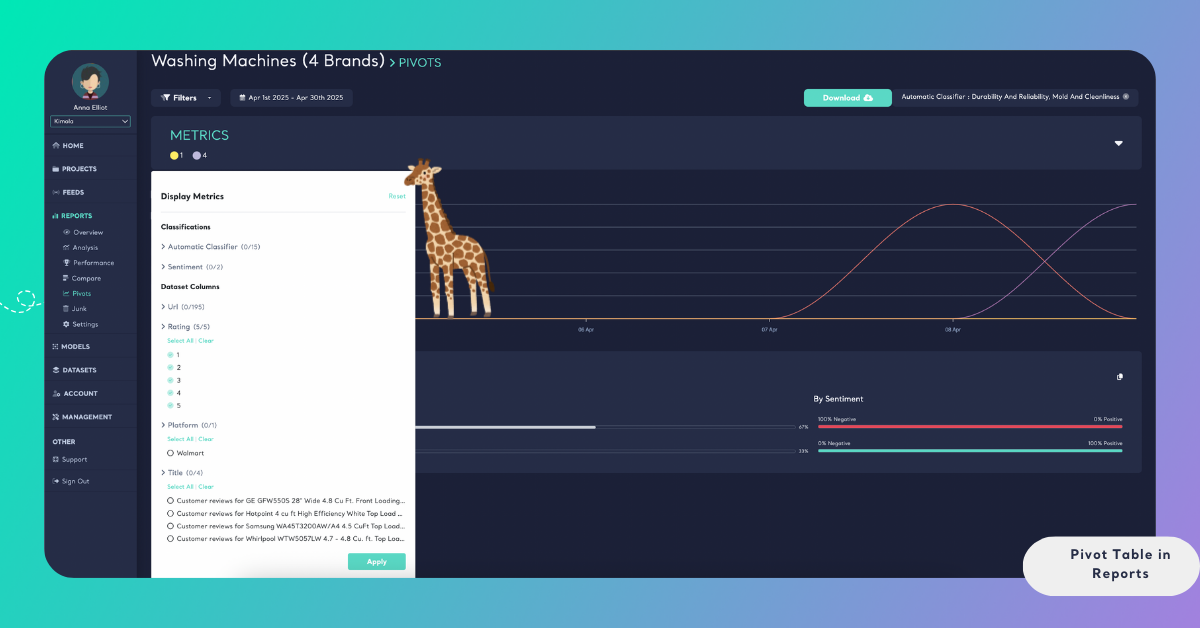
In the Pivot view, you build your table by selecting metrics and dimensions.
From the Metrics dropdown:
- Choose one or more fields to analyze (for example, product title, country, rating, or other available columns)
- Click Apply to generate the pivot table
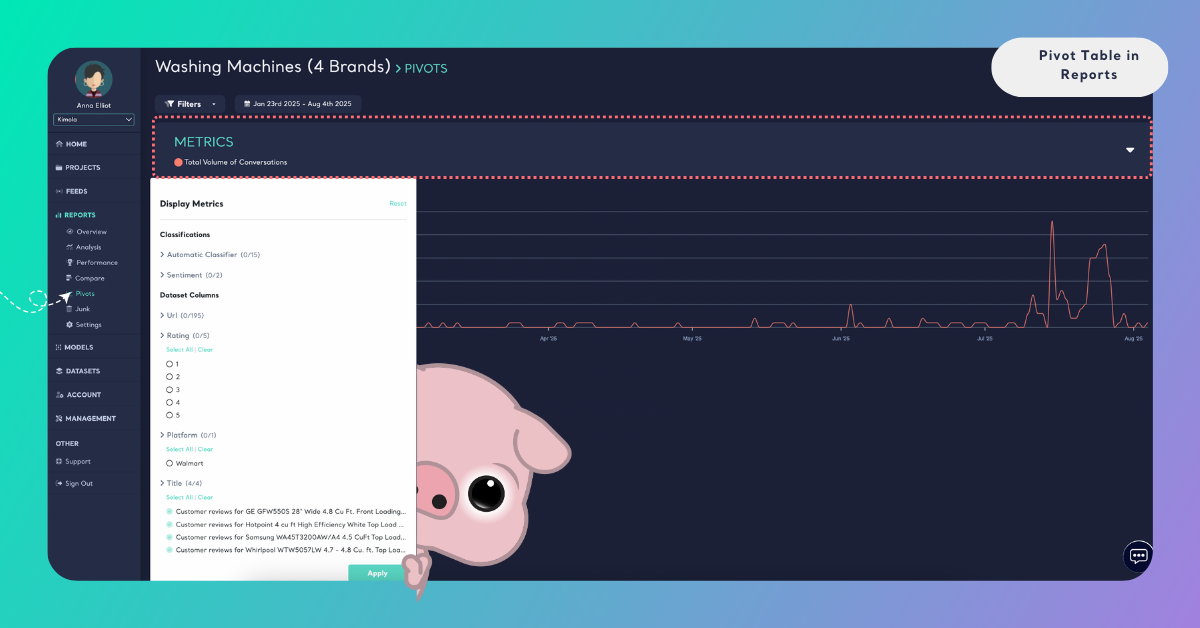
Kimola automatically displays:
- Volume values for the selected metrics
- Sentiment distribution associated with those metrics
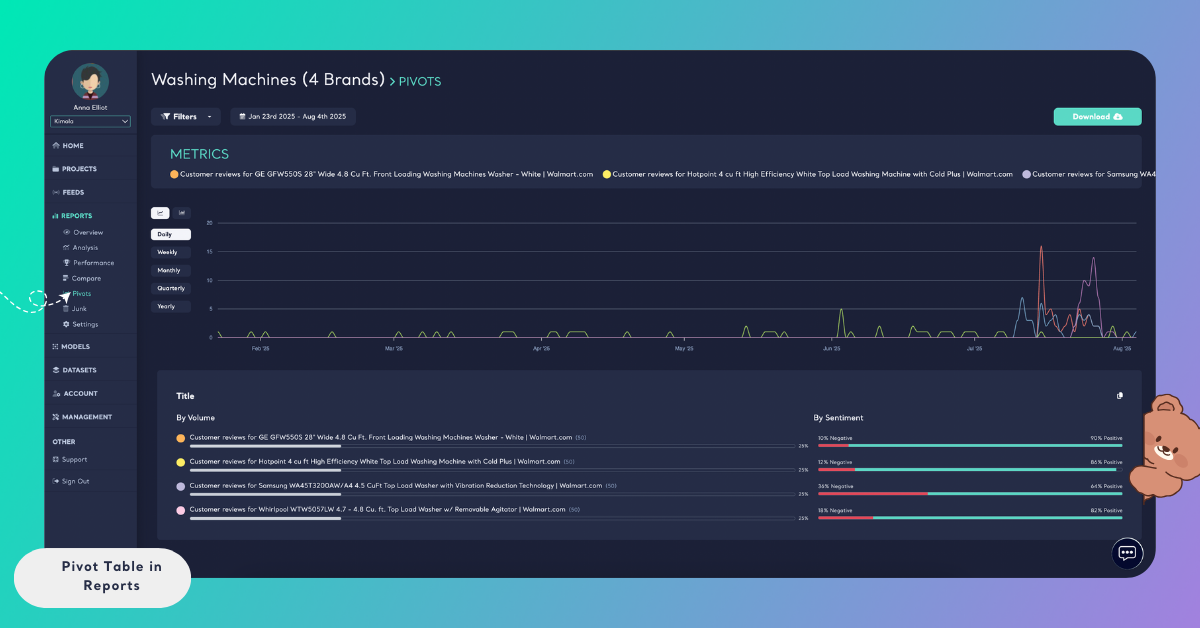
The pivot table updates instantly based on your selections.
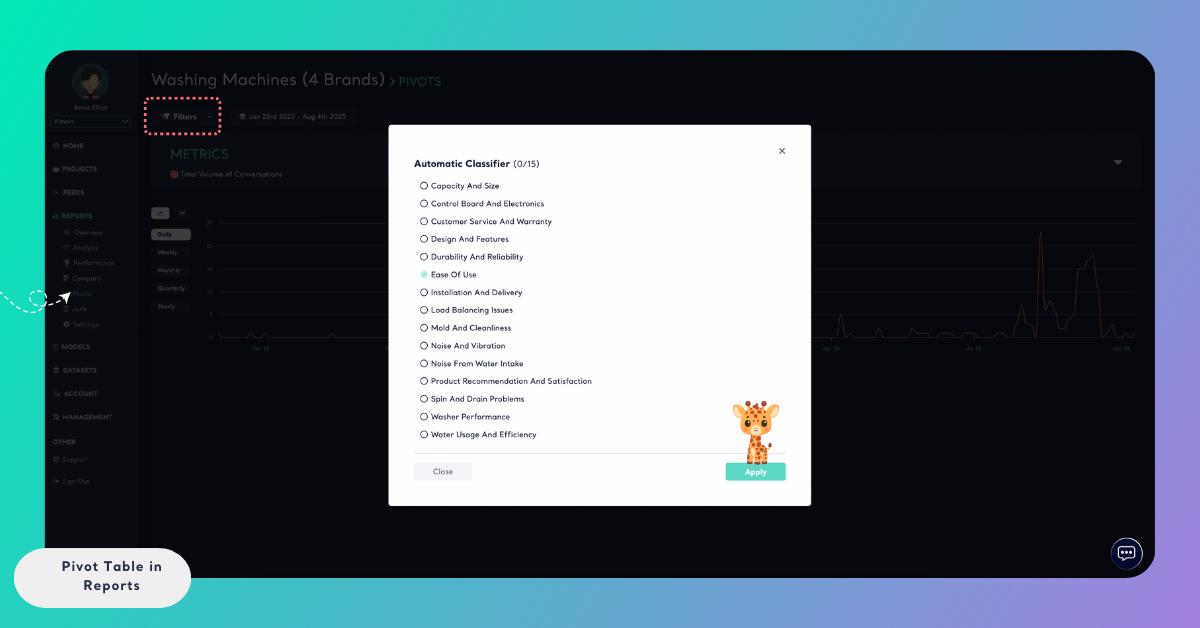
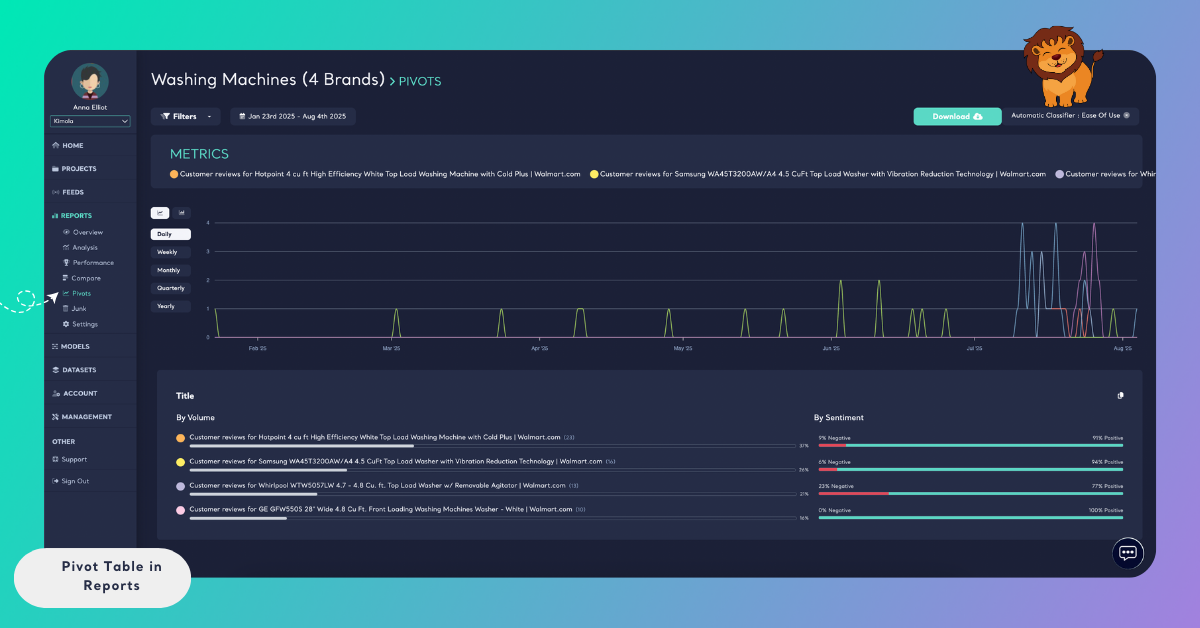
Use Filters with a Pivot Table
Pivot tables can be combined with filters to further refine analysis.
From the Filters section, you can filter data by themes, classifiers, date ranges, or other available fields.
By selecting Filters → Automatic Classifier → Ease of Use, you can limit the dataset to records related to that theme
Once filtered, you can then select a metric such as Product Title to see how the Ease of Use theme performs across different products.
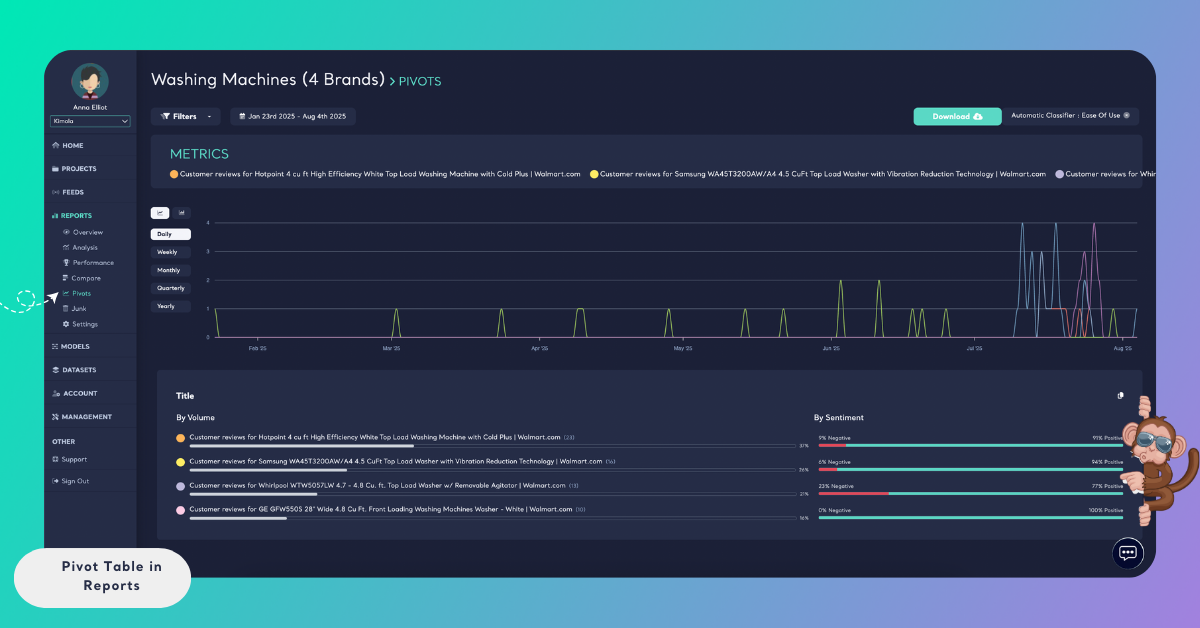
You can also apply a date range filter to analyze how a metric’s volume and sentiment change over a specific time period. Pivot tables automatically update to reflect the selected date range and filters.
Reset Selection in a Pivot Table
While working with pivot tables, you may apply multiple selections—such as metrics, classifiers, dataset columns, or date ranges—to explore your data from different angles. At any point, you can reset these selections to return to a default or broader view.
Metrics selected in the Metrics panel can be cleared using the Reset option located in the top-right corner of the Metrics window. This action removes all currently selected metrics and returns the pivot table to its initial state.
Resetting metrics is especially useful when you want to start a new analysis without manually deselecting each metric one by one.
Filters applied from the Filters menu—such as classifiers or dataset columns—are shown in the top-right corner of the Pivot Tables page. You can remove individual filters by clicking the × (remove) icon next to the selections.
Resetting metrics or filters does not affect the underlying report data. These actions only change how data is summarized and displayed in the pivot table.
Export or Copy a Pivot Table
Pivot tables in Kimola can be easily reused outside the platform for reporting or presentation purposes.
You can copy the values displayed in a pivot table by using the Copy icon located in the top-right corner of the table. This allows you to paste the data directly into external tools such as Excel, documents, or other reporting environments.
Pivot tables can also be exported as a PowerPoint (PPT) file using the Download option in the top-right corner of the page. The exported presentation is ready to use and preserves the structure of the pivot table.
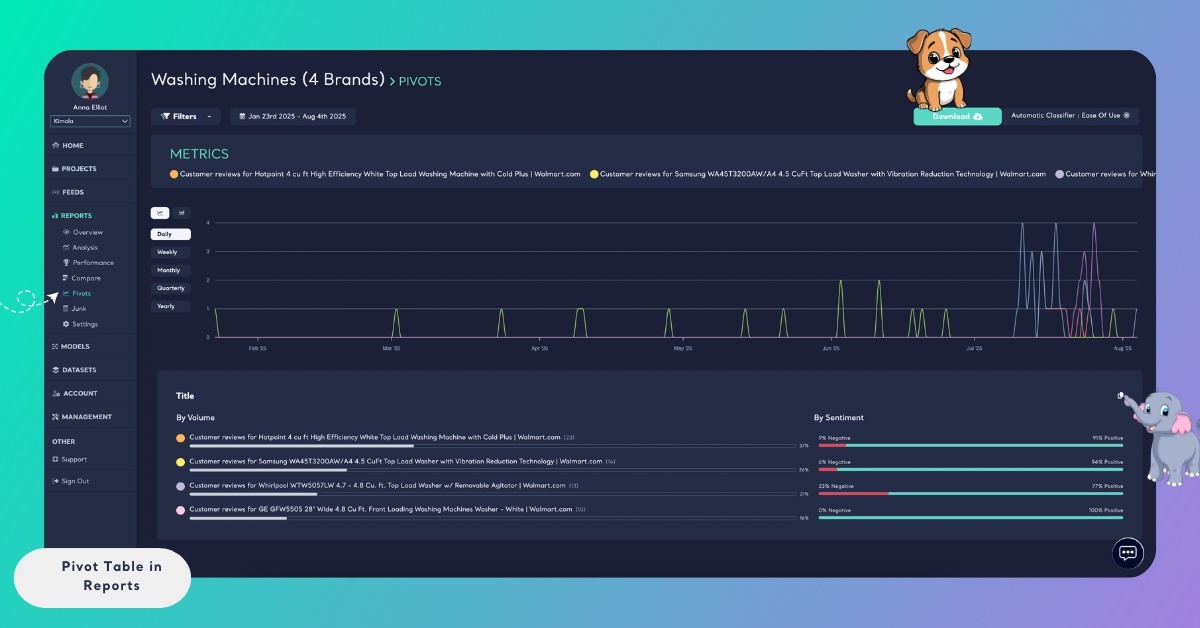
These options make it easy to share pivot insights, include them in presentations, or reuse them in external reports—without needing to recreate the analysis manually.