Create a Report by Uploading a Custom Dataset
4 mins read - Created on Feb 19, 2025In Kimola, a custom dataset refers to any dataset that you upload manually instead of collecting directly from a link or integration. This typically includes files such as Excel or CSV documents containing customer feedback, survey responses, call-center transcripts, CRM exports, or other text-based data you already have.
Uploading a custom dataset allows you to analyze your own data in Kimola and turn it into a structured report with themes, sentiment, and insights. This option is ideal when your data does not come from a supported platform link, or when you want full control over the dataset being analyzed.
This guide explains how to create a report by uploading a custom dataset in Kimola.
Sign in to your Kimola account and go to the Dashboard Home page.
Step 1: Upload Your Custom Dataset
On the dashboard home page, locate the Create your report section.
From here, start by using Upload your custom dataset:
- Drag and drop your dataset file into the upload your custom area, or
- Click upload your custom and select your file from your computer
Kimola supports Excel (.xlsx) and CSV (.csv) file formats.
Once uploaded, Kimola will automatically move you to the dataset configuration screen.
Preparing your dataset correctly helps ensure accurate analysis results.
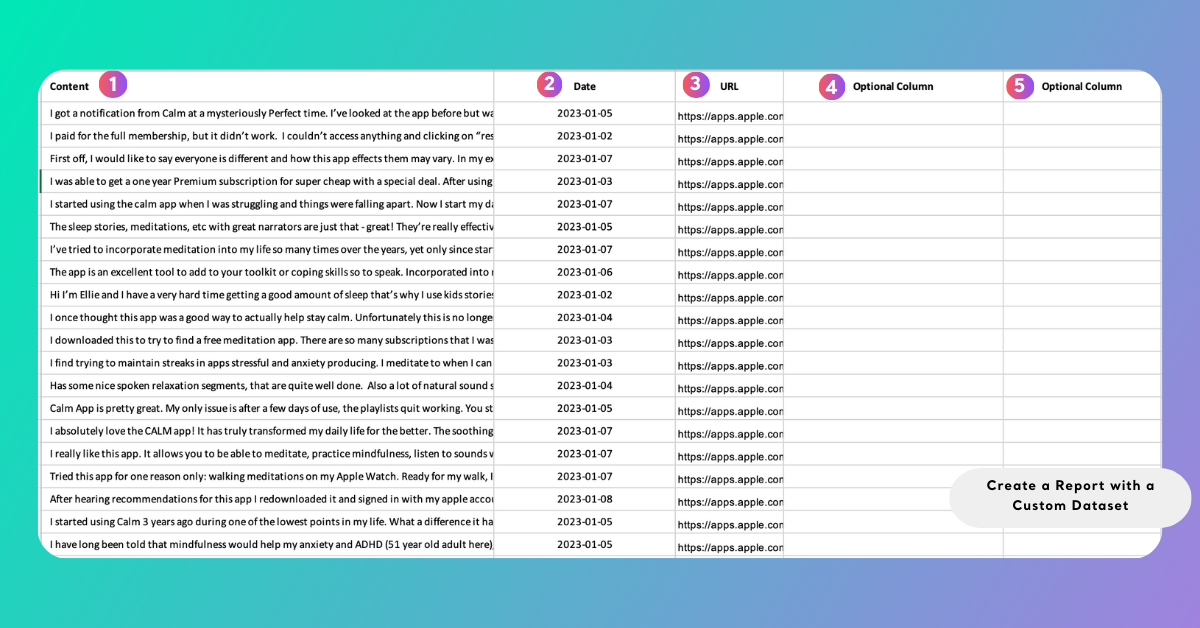
• Header row required
The first row must contain column names so Kimola can recognize each field.
• Text column required
This column should include the content to be analyzed (e.g., reviews, comments, survey answers).
• Date column (optional)
Enables time-based analysis and trend visuals when available.
• URL column (optional)
Allows direct access to the original source from the report.
• Additional columns (optional)
Extra fields such as product or region become available as filters inside the report.
Step 2: Select Relevant Columns
After upload, map your dataset columns:
- Select the column containing the main text for analysis
- Optionally select date and URL columns if available
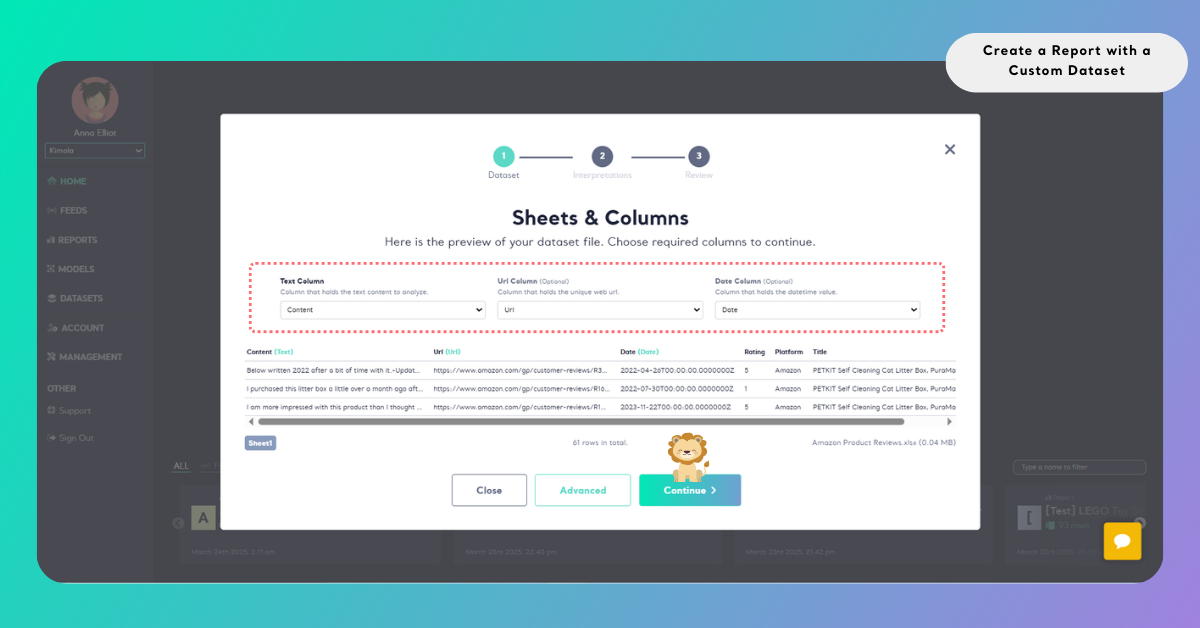
This step ensures Kimola analyzes the correct data.
Step 3: Select Dimensions (Optional)
Dimensions are optional analytical layers in Kimola that help organize customer feedback into structured categories such as motivations, pain points, unmet needs, personas, experience stages, and usage contexts.
Selecting dimensions allows you to enrich your report with deeper qualitative analysis outputs in addition to standard analysis results such as sentiment, themes, and trends.
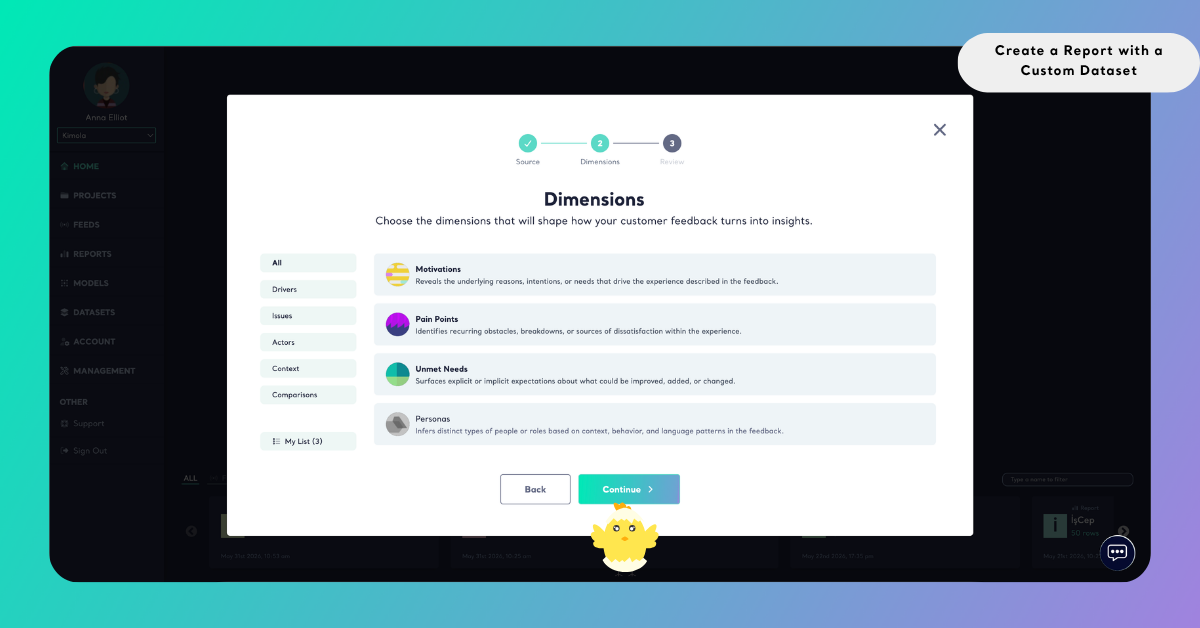
You can skip this step if no dimensions are needed.
Selected dimensions appear under My List on the left side, allowing you to review and adjust them before creating the report.
Dimensions use queries during generation and analysis. Query usage depends on factors such as the number of records included in the report and the dimensions selected for generation.
Step 4: Configure Report Settings
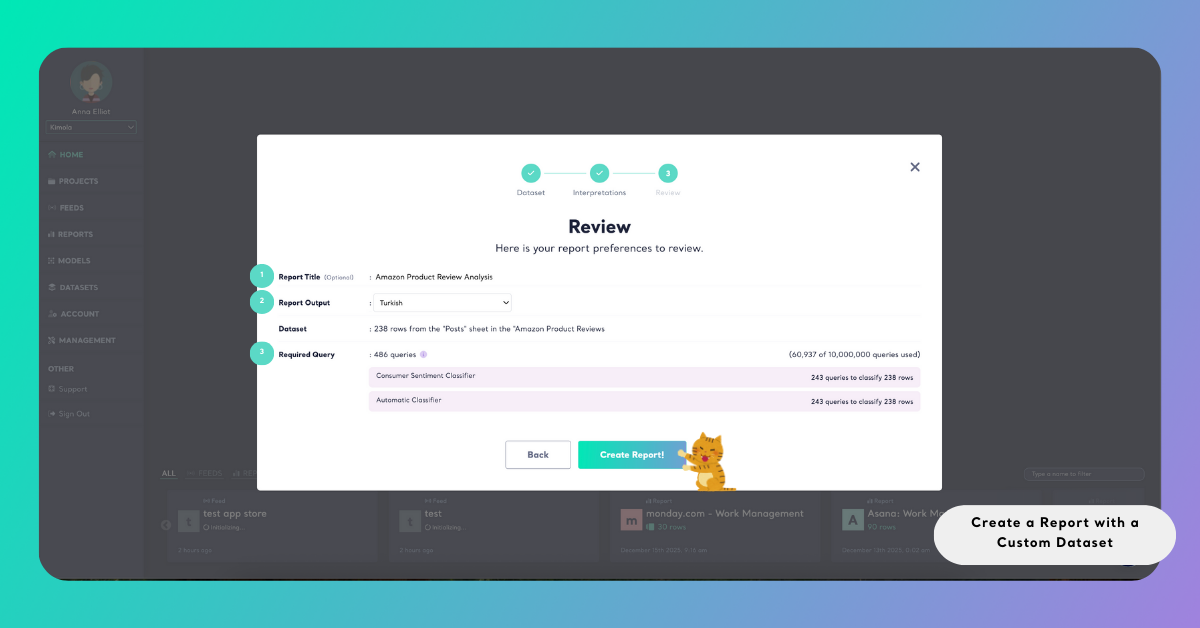
Before creating your report, review and complete the following settings. All required fields must be filled in to proceed.
Report Title
Enter a clear and descriptive name for your report. This field is required. Kimola does not allow report creation without a title. Using a meaningful name helps you easily identify the report later in the Reports list, especially when working with multiple datasets or analyses.
Report Output Language
Select the language in which you want the report outputs to be generated. This setting determines the language of analysis results such as sentiment labels, topic names, dimensions, and summaries.
Required Queries
The Required Query section shows how many analysis queries will be consumed to generate this report.
Queries represent the processing units Kimola uses to analyze your data.
Each selected classifier or dimension consumes queries based on the number of records in the dataset.
In this section, you can see:
- The total number of queries required to create the report
- A breakdown of queries used by each selected model (for example, sentiment or automatic classifiers)
- Your current query usage compared to your plan’s total query limit
This overview helps you understand the cost of running the analysis and manage your query usage effectively before creating the report.
Create the Report
After reviewing all settings and query usage, click Create Report to start the analysis. Kimola will process the dataset using the selected configurations and generate your report based on the available data.
Once completed, your report will be available in the Reports section, where you can review insights, apply filters, and export results.