Signals: What Stands Out
in Customer Feedback
Kimola tests every topic against every segment and period in your feedback and shows only the differences that hold up, with the evidence.
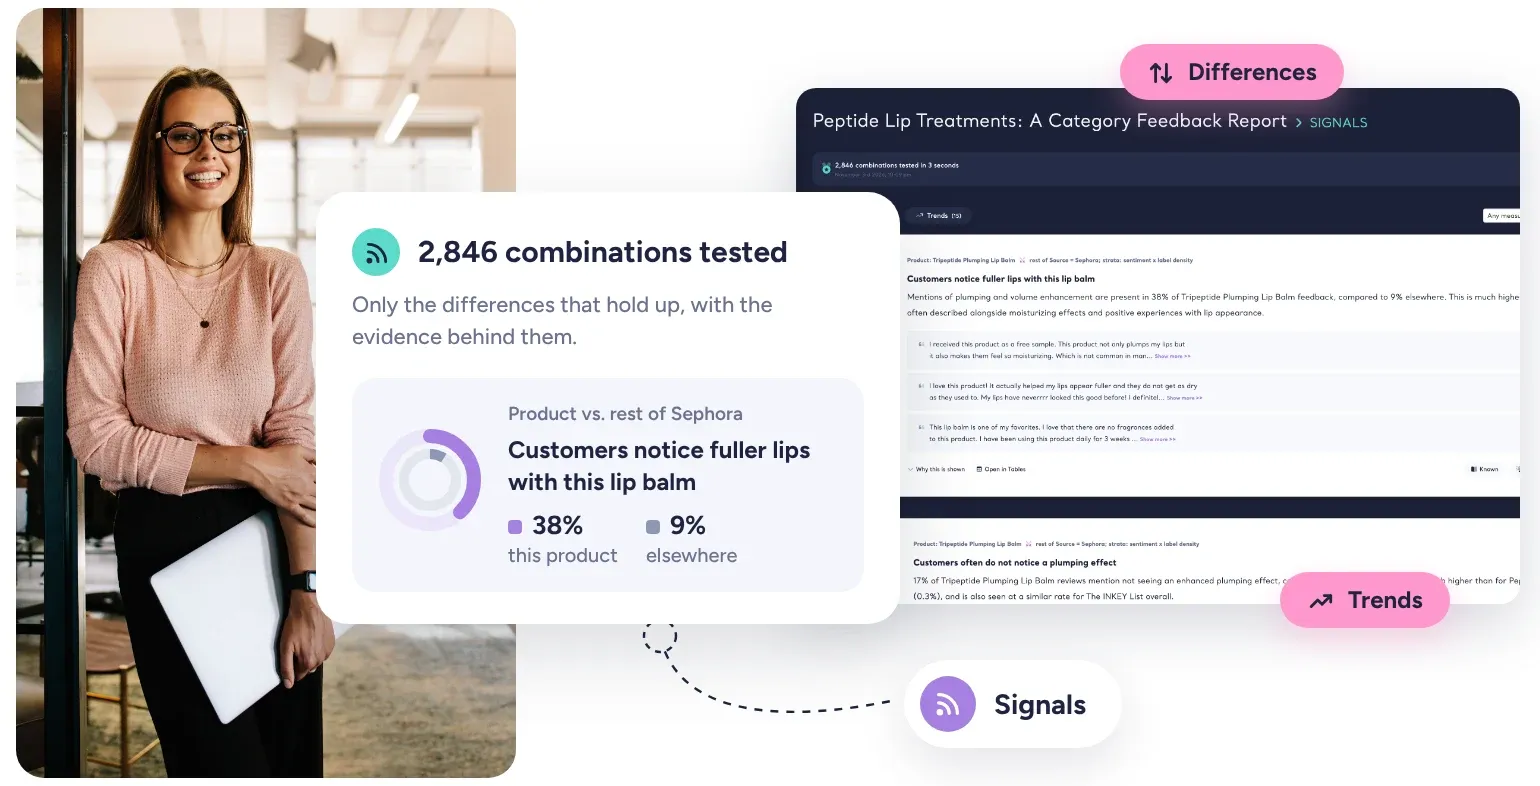















3,000+ teams in more than 90 countries use Kimola.
The Combination You Didn't Look At
Themes, sentiment, research Dimensions, your own columns and time: a few thousand pieces of feedback already hold thousands of combinations that no team can check by hand. Sorting by volume doesn't help: a topic common everywhere is common in every group too, so the top of that list only confirms what you already know.
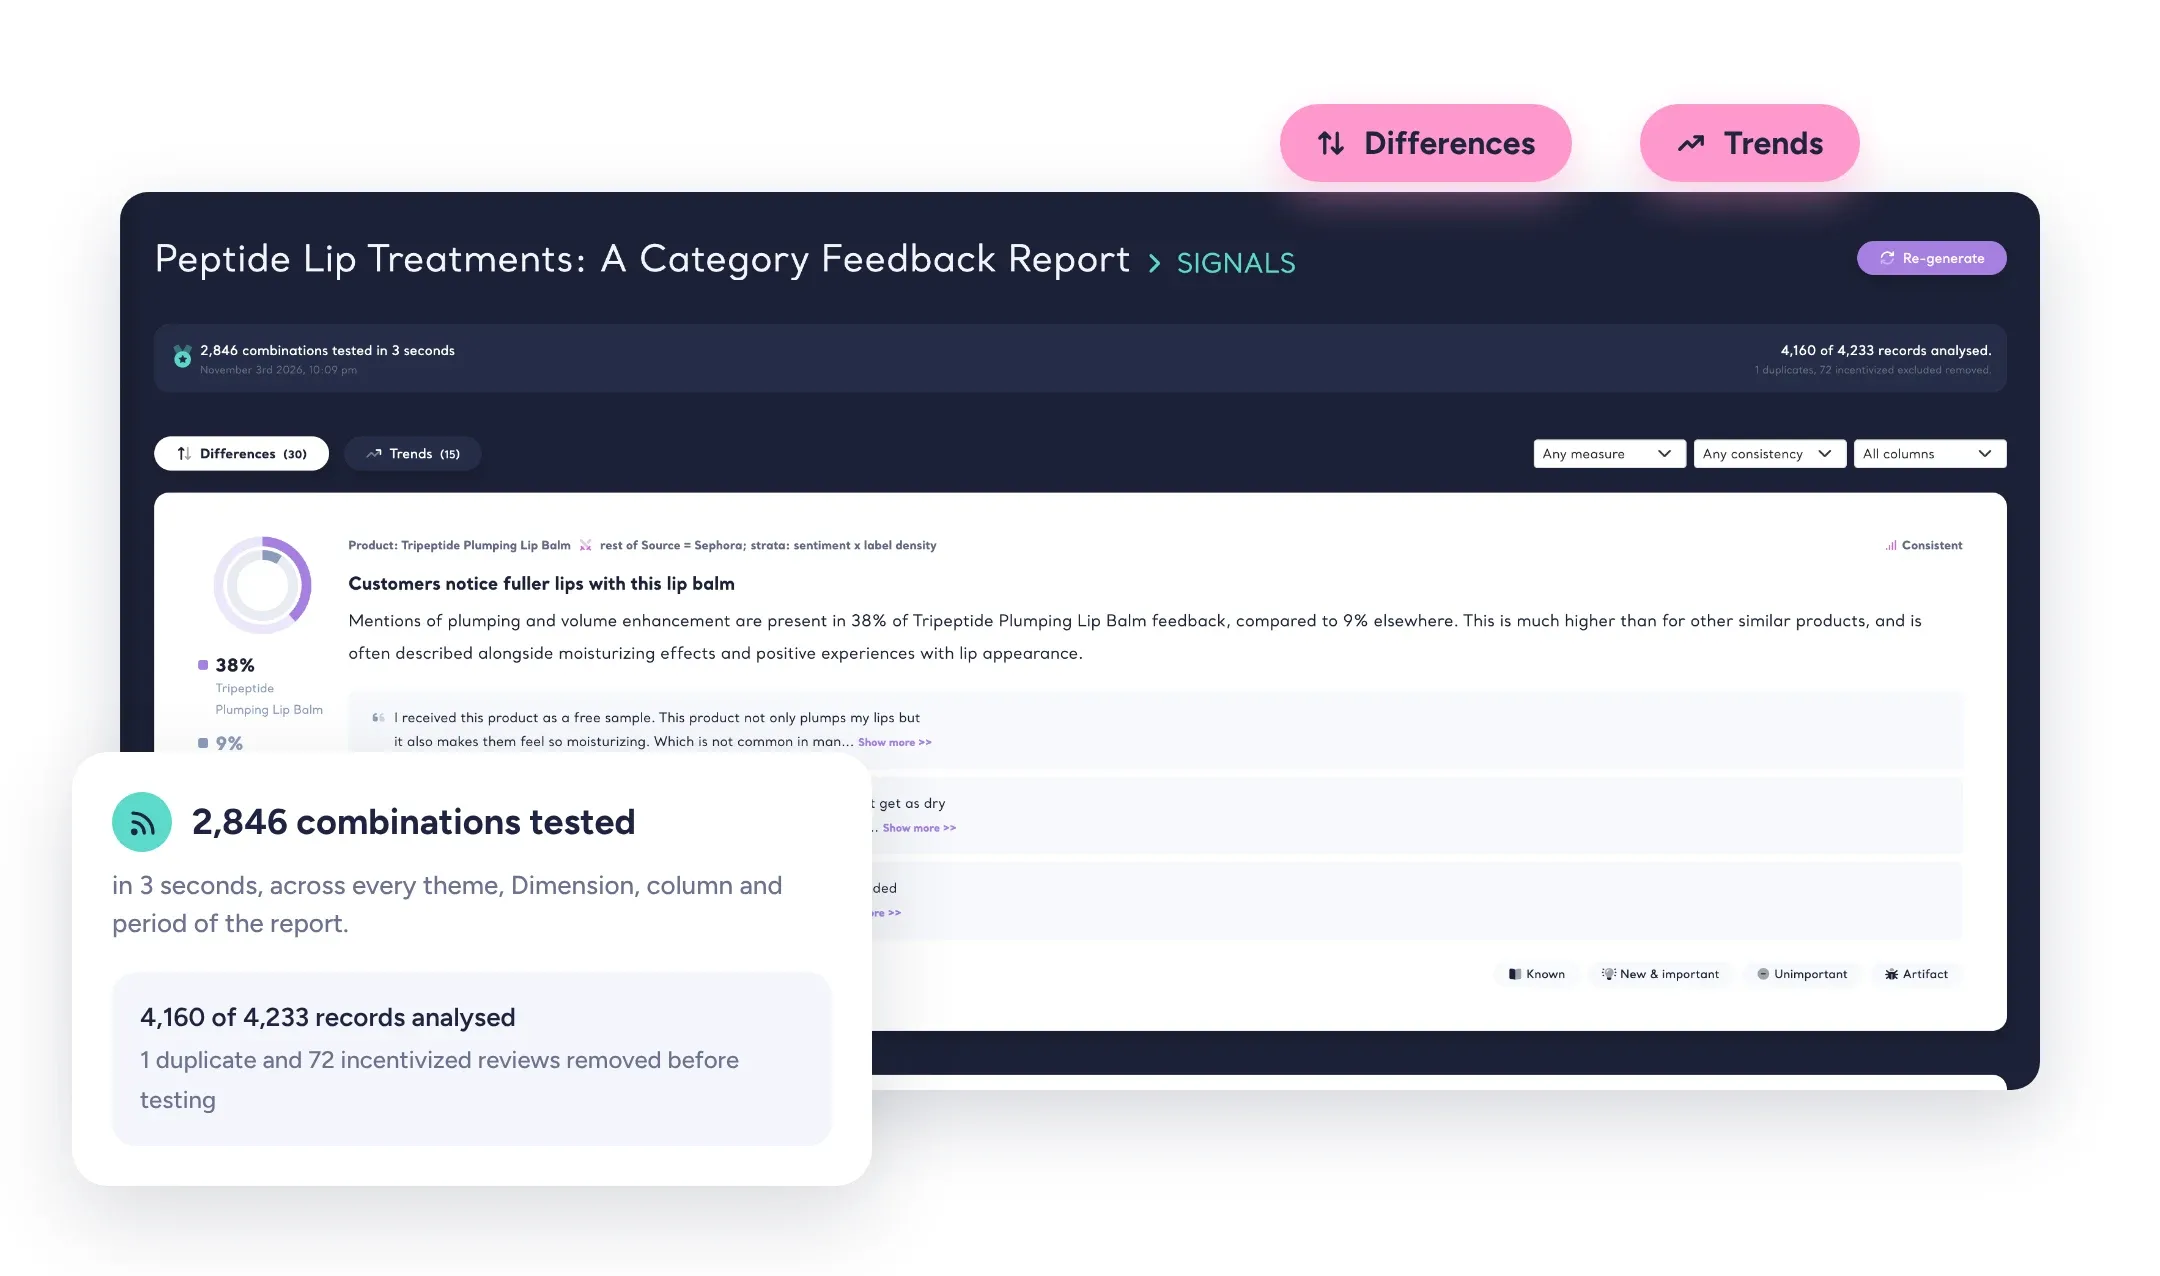
Kimola checks every combination for you and brings back two lists: Differences, where a topic stands apart in one group, and Trends, where it is rising or falling over time.
Related: What is a Signal?
Your Columns Become the Research
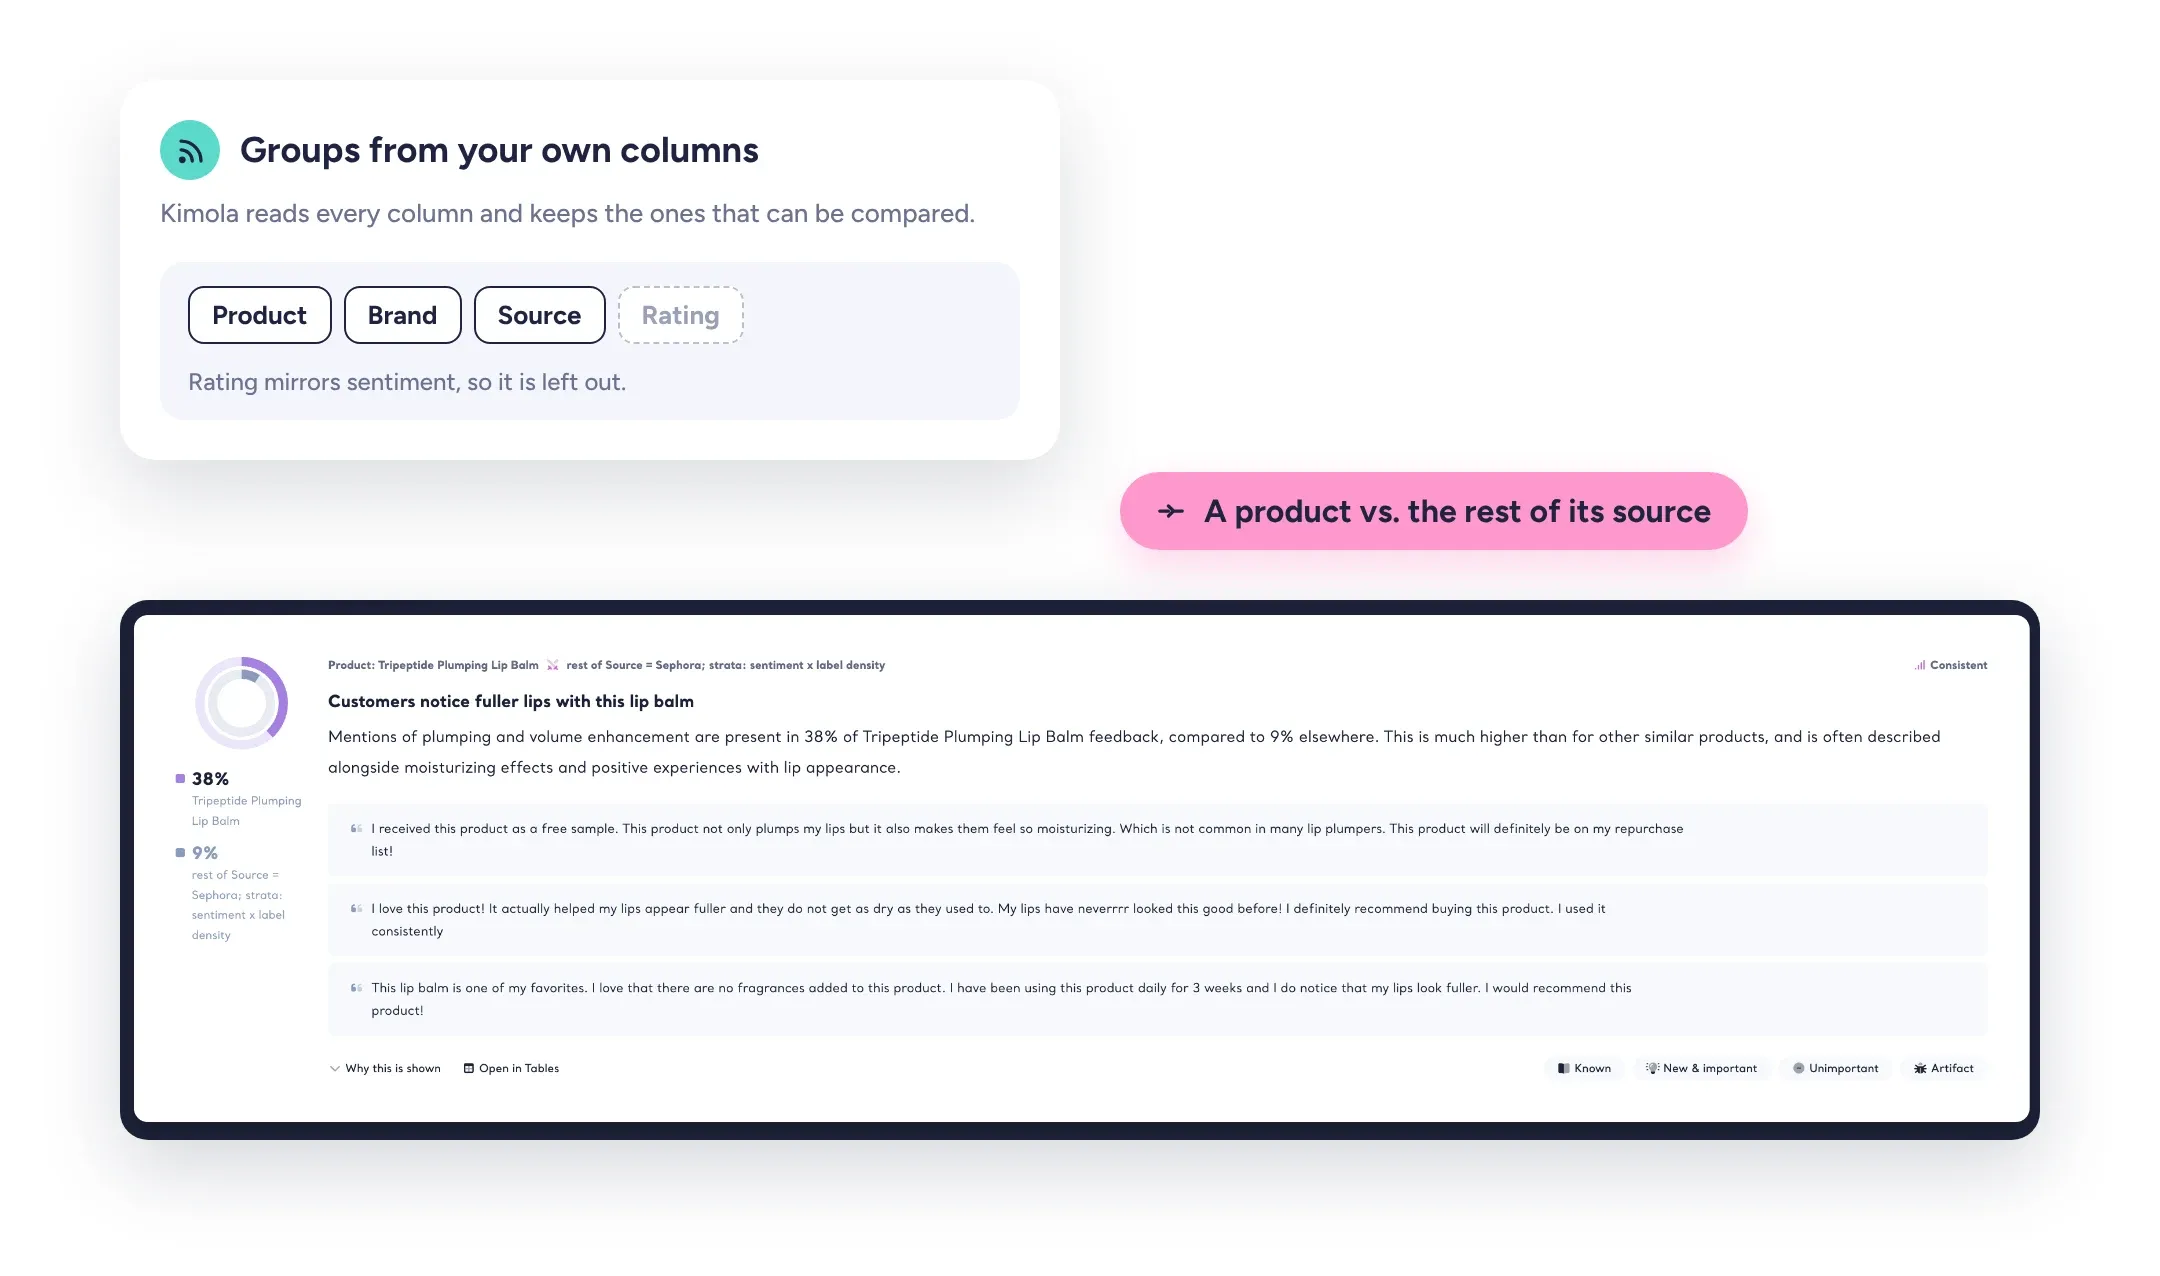
Product, brand, platform, country, channel: the columns already in your data become the groups Kimola compares, alongside the answers of its research Dimensions. Kimola compares a product with the other products of its own brand, and points out when a single product is behind a brand-level problem.
The result is a finding with an address: not "customers complain about delivery", but where, in which product and by how much. That also tells you which team should pick it up.

Tested, Not Ranked
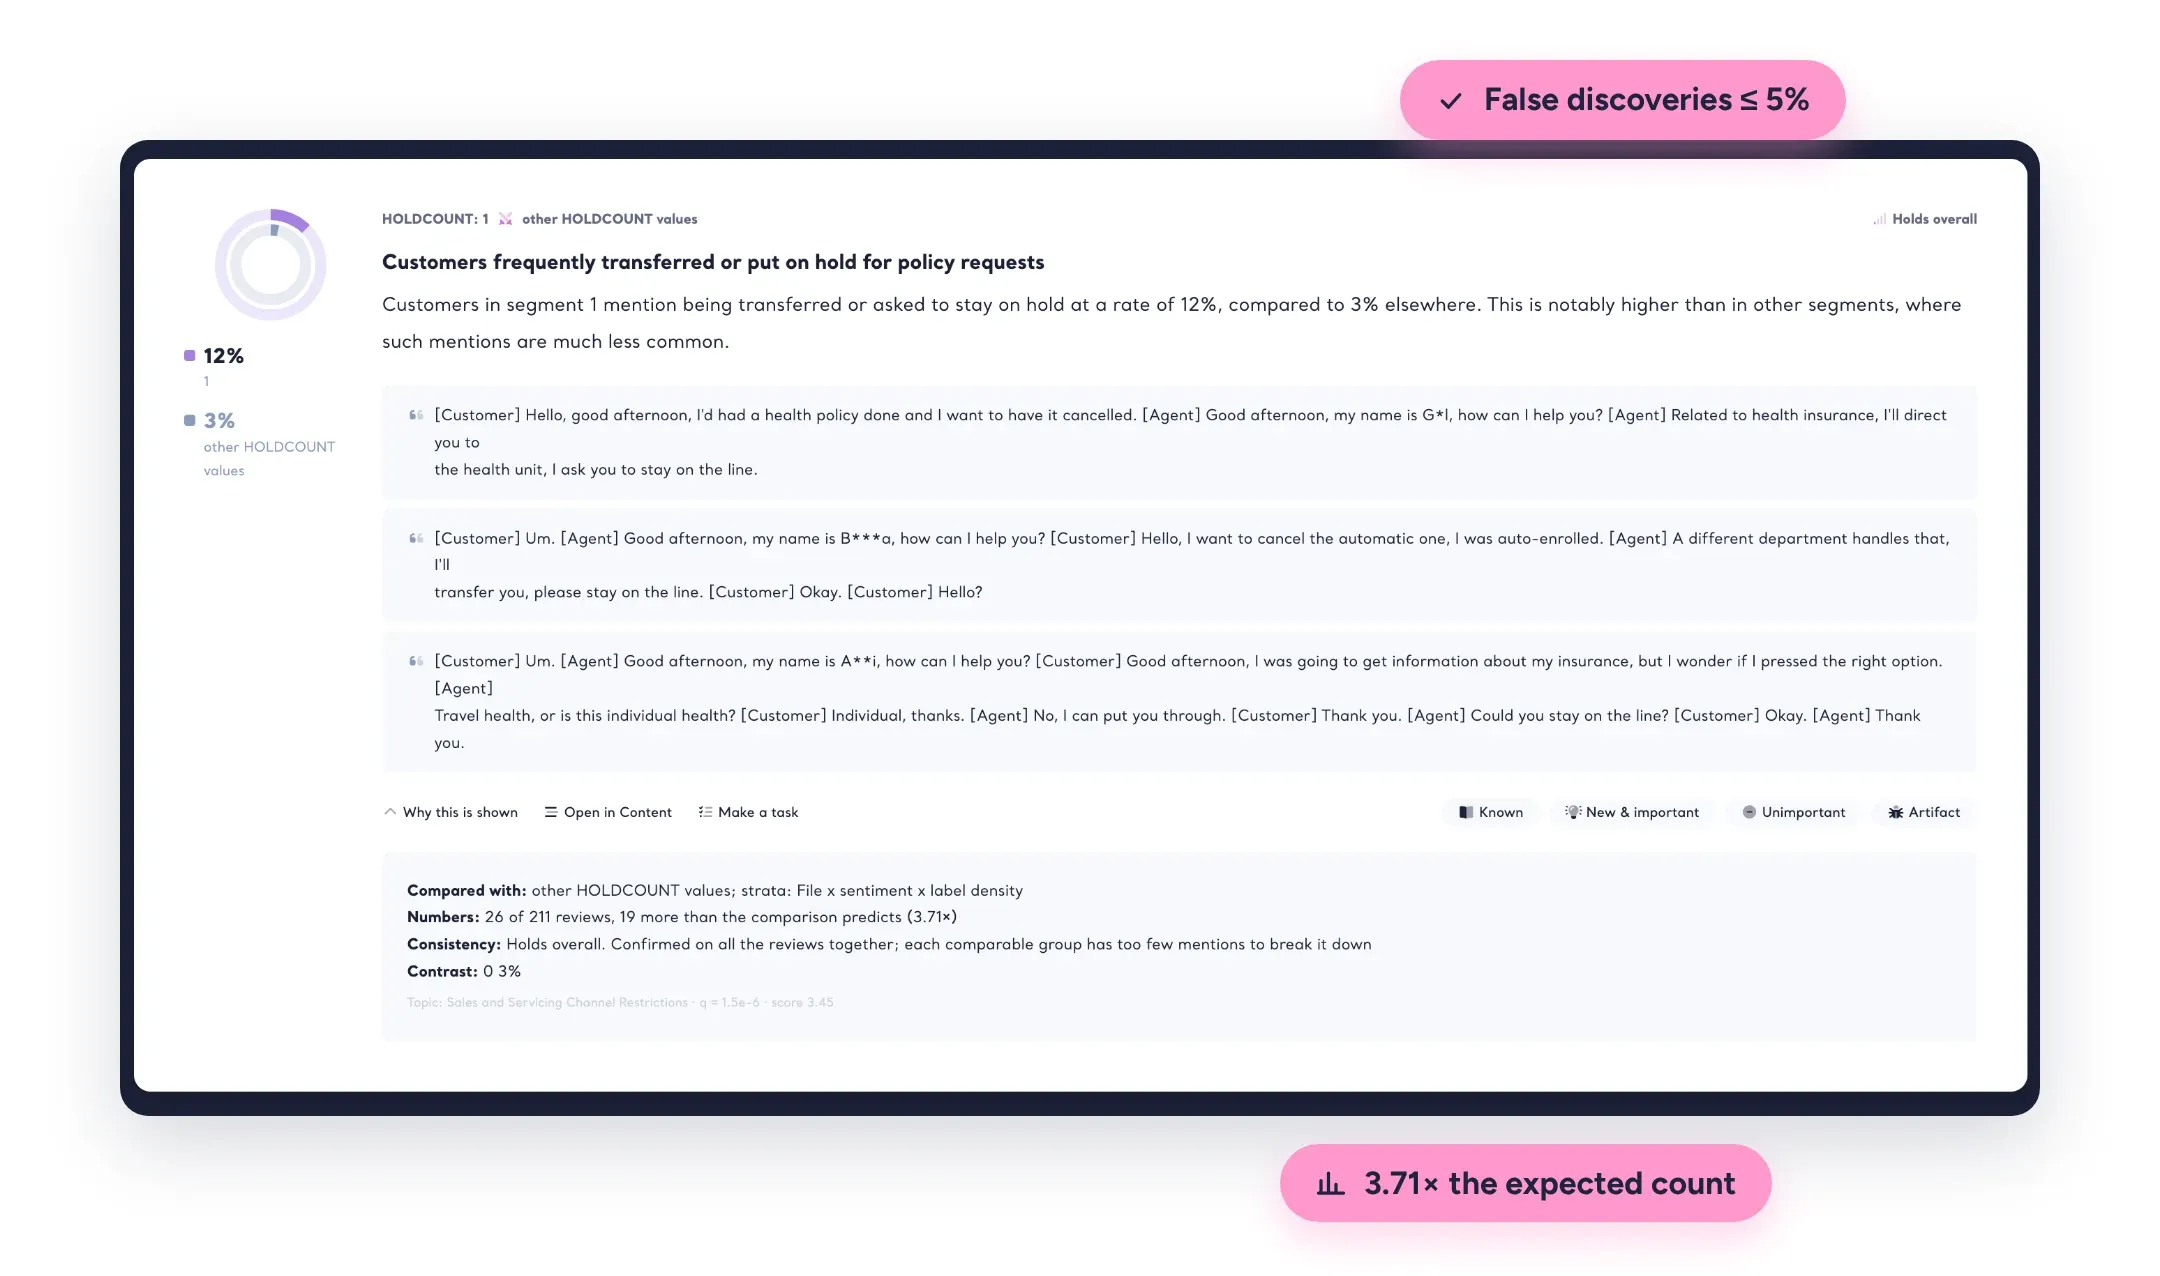
Kimola doesn't rank combinations by how big they look. It tests every one of them within comparable feedback and corrects all tests together to keep false discoveries at 5% or below. The same data always gives the same Signals, and when nothing holds up, Kimola says so.
A language model comes in only afterwards, to write each card from numbers already computed. It can't add findings or guess reasons customers didn't give, and every card carries its evidence, so you can defend it in any meeting. Read how Signals was built.
From a Signal to a Decision
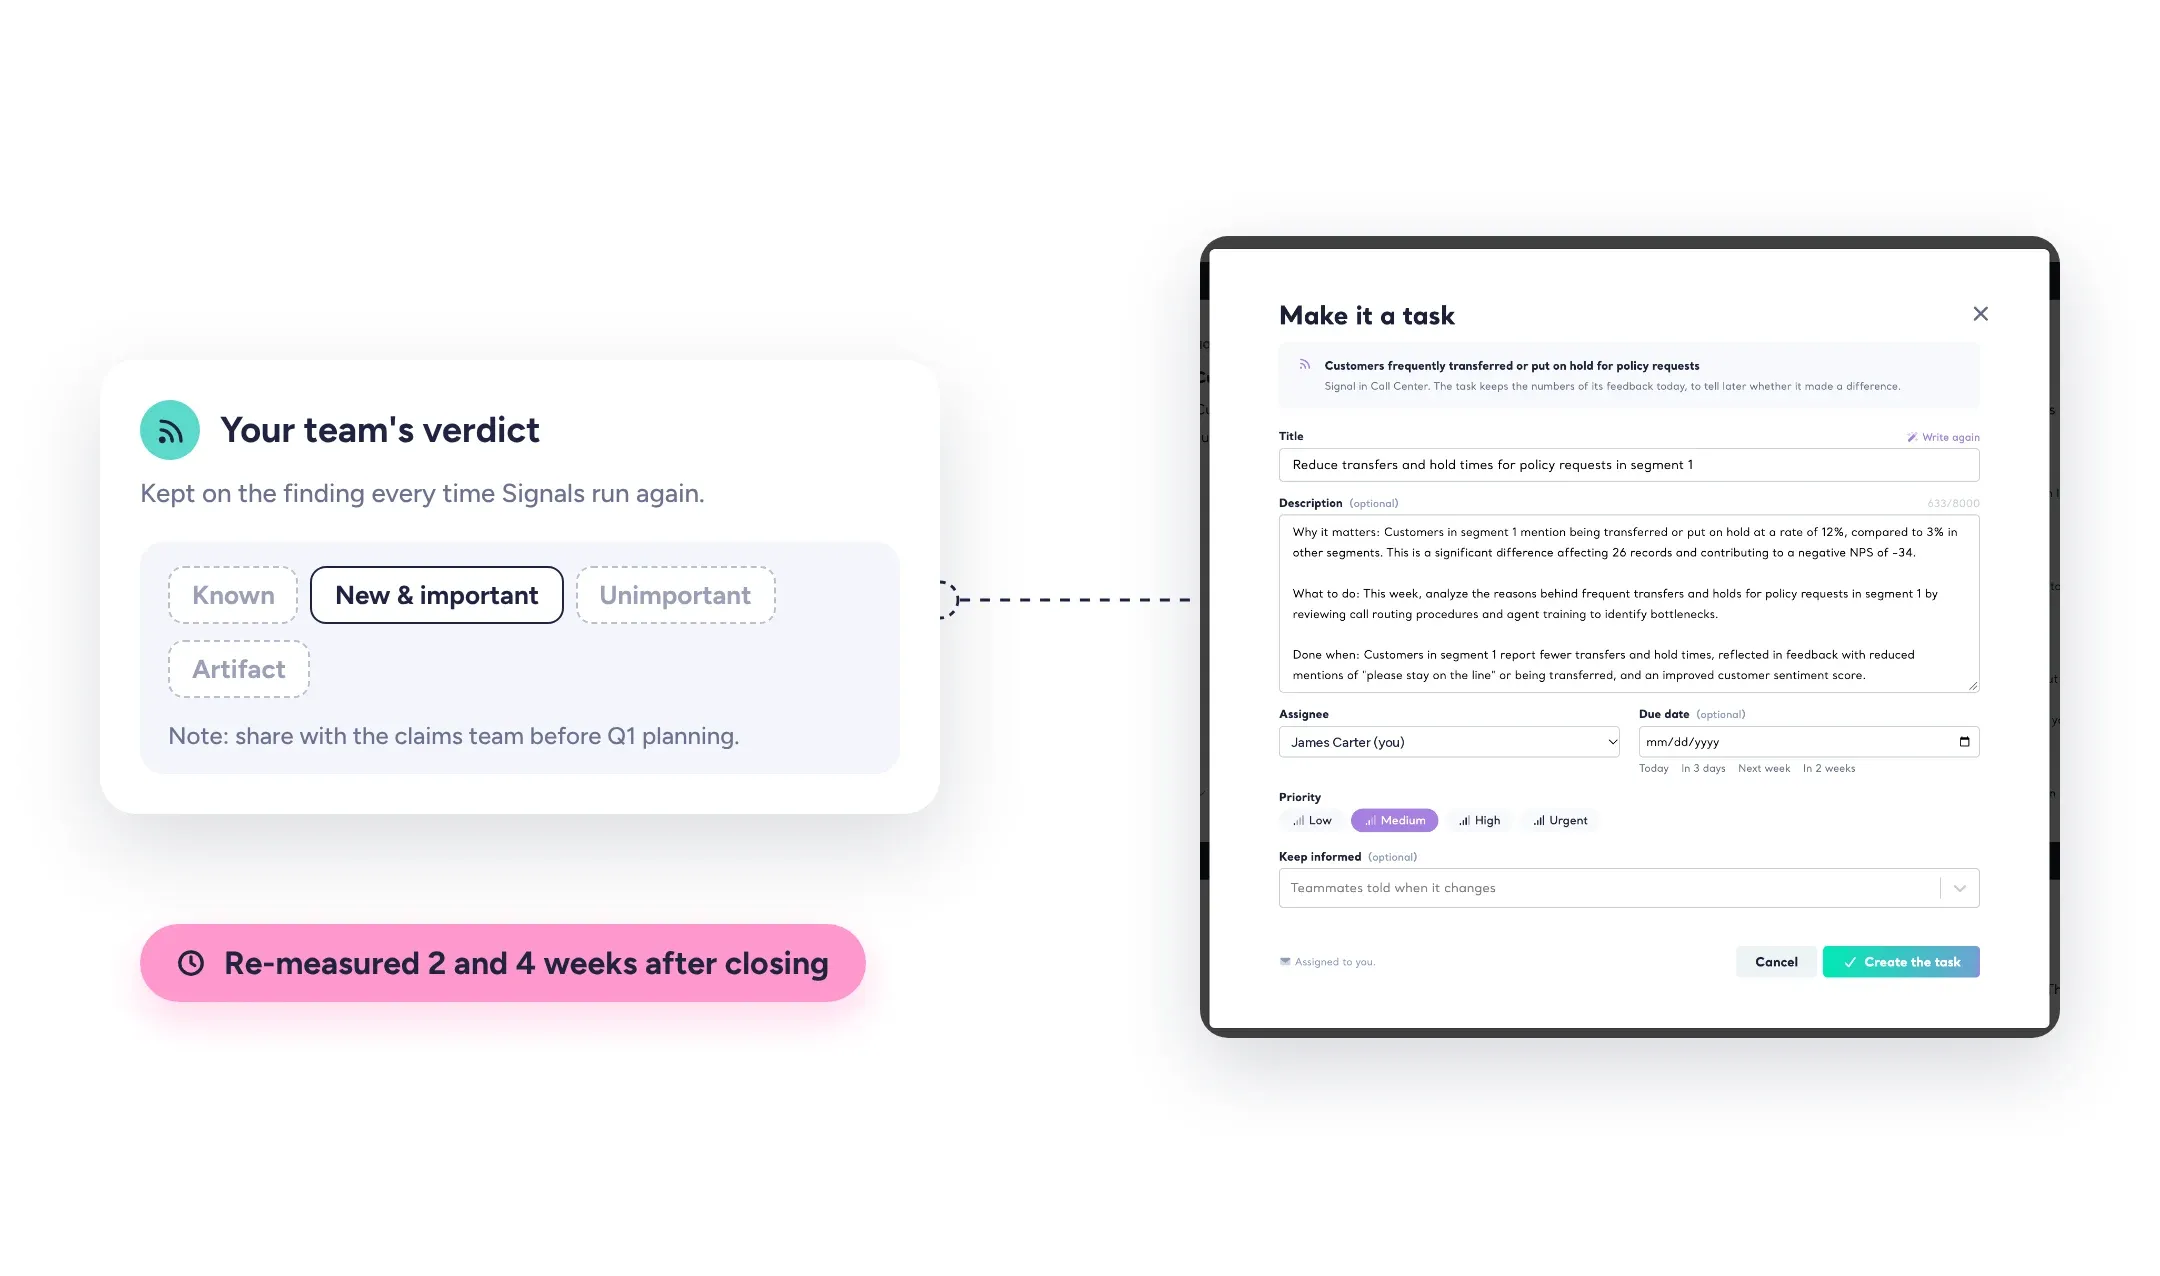
A Signal is where work starts. Your team marks each one as known, new or unimportant, and that judgement stays with the finding every time Kimola runs Signals again. In a Space, a Signal becomes a Task in one click, with its numbers kept as evidence, and Kimola later checks whether the topic actually changed. Action Plans build on Signals to recommend what to do next, keeping only the recommendations the data supports.
Related: Review Signals
In Reports and Spaces
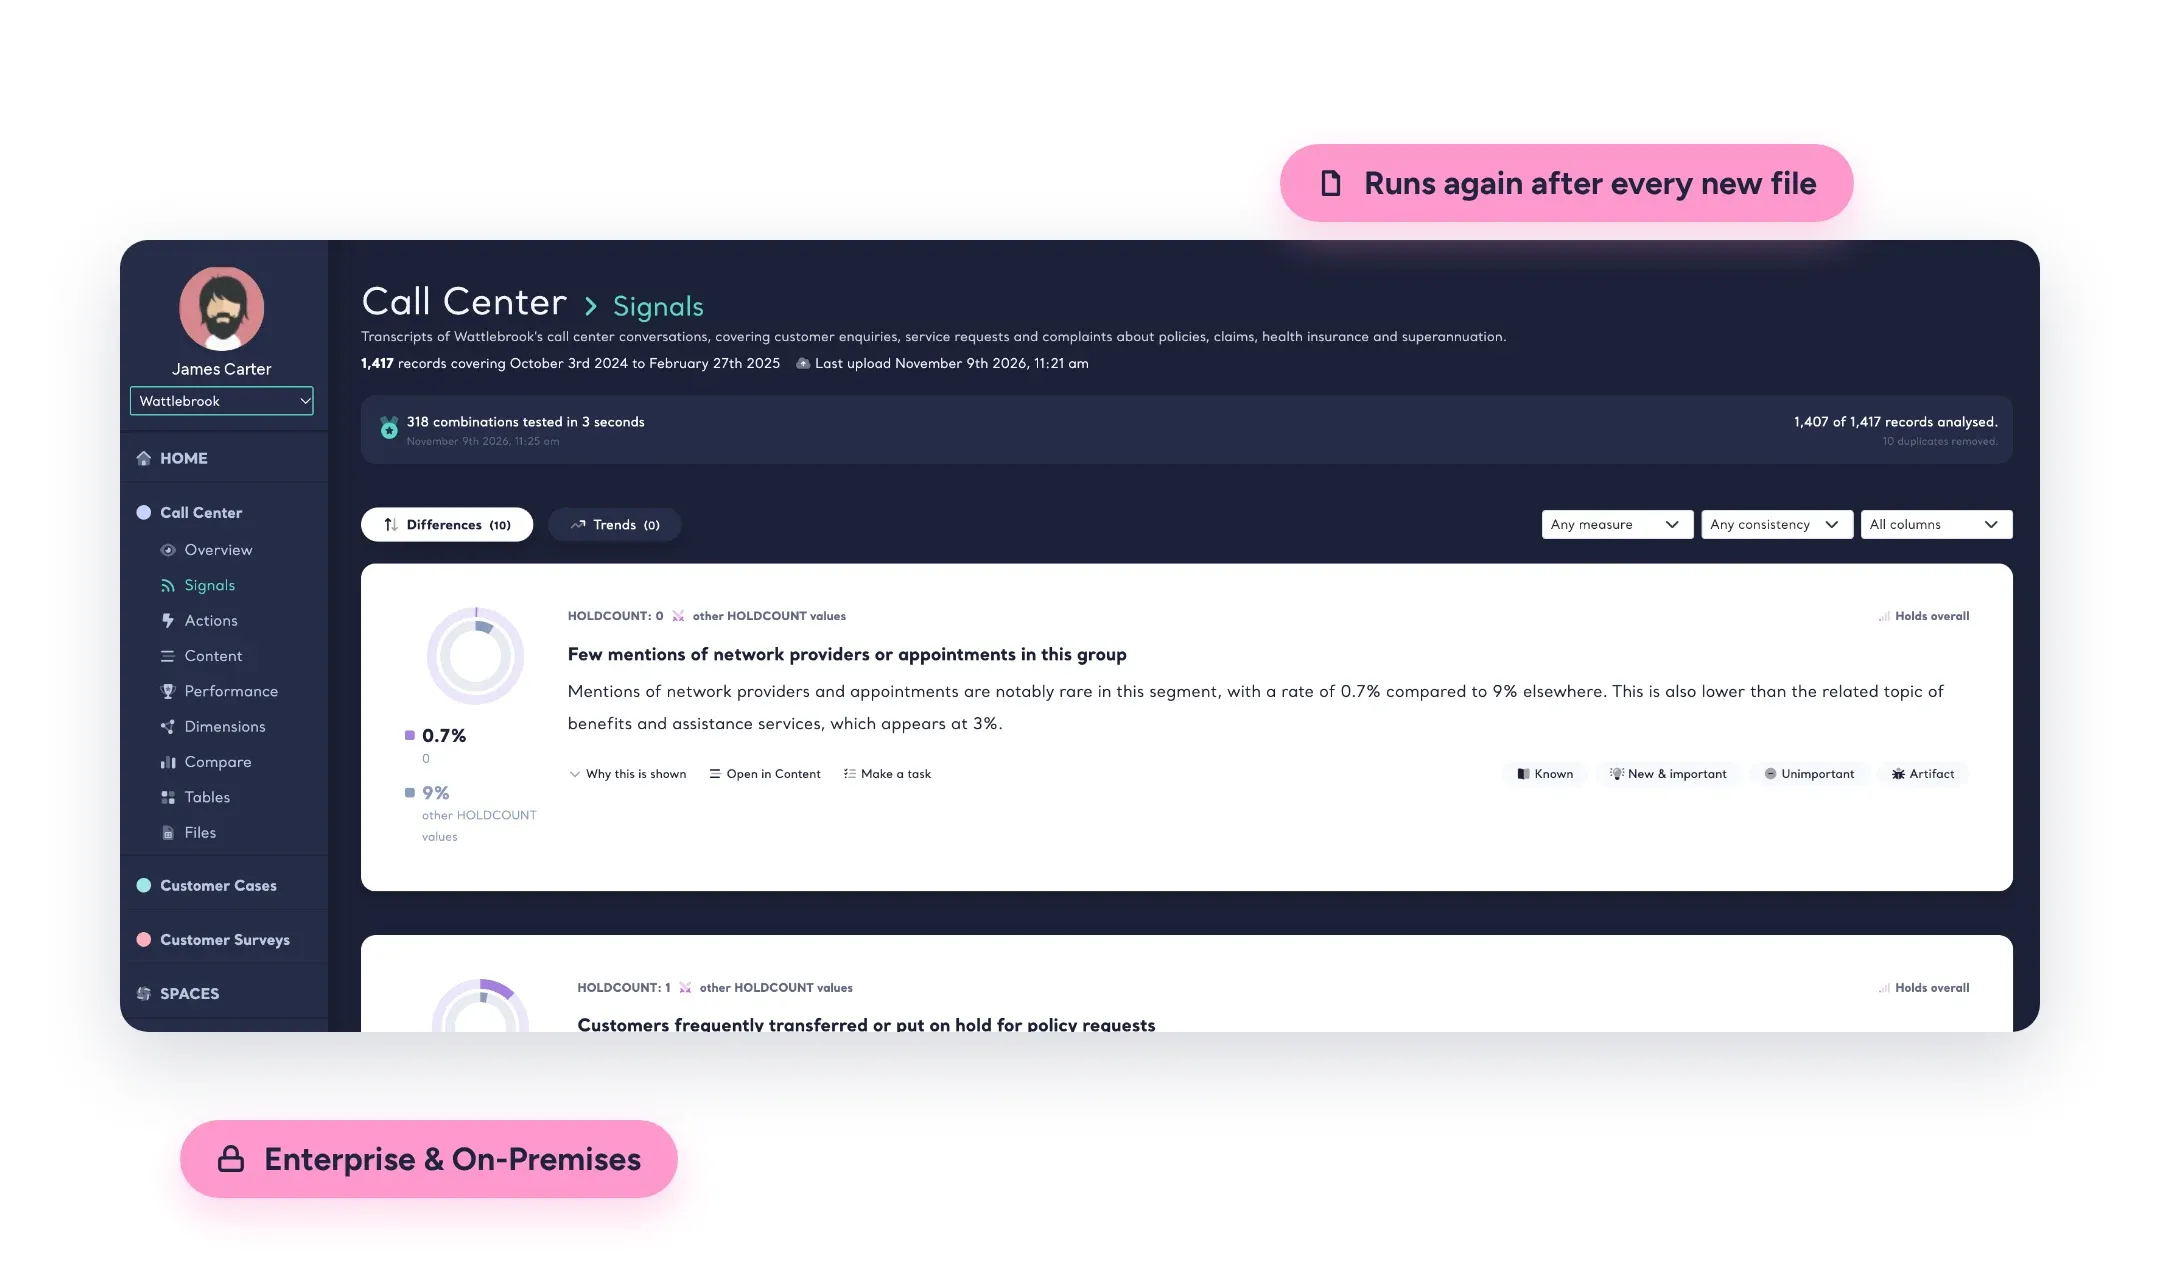
In a Report, Signals arrive automatically once the analysis is complete, with nothing to set up. In a Space, where feedback keeps flowing in from your channels, Kimola runs them again after every new file, so whatever stands apart in the latest delivery surfaces as soon as it lands.
Signals in Spaces are part of the Enterprise package and Kimola On-Premises. Every new account comes with sample reports, so you can explore Signals before uploading anything.
Related: Signals in Reports · Signals in Spaces
Bring the feedback you already have.
Organize feedback like a research team.
See the people behind the feedback.


See how teams turn different kinds of feedback into research.






Frequently Asked Questions
About Signals
-
How are Signals different from the most mentioned topics?
The most mentioned topics show what is large. Signals show what is different: a topic that appears noticeably more, less or more negatively in one group than in comparable feedback elsewhere, or one that has changed over time. A small topic concentrated in one product or platform can be a Signal, while a large topic spread evenly everywhere usually isn't.
-
Do I need to set anything up to get Signals?
No. Kimola generates Signals automatically after a Report's analysis is complete, and after every classified file in a Space. Kimola decides by itself which columns of your data can be used as groups.
-
What kind of data gives the most useful Signals?
Data that says where each piece of feedback came from. Columns such as product, brand, model, platform, store, country, channel or customer type give Kimola groups to compare, and a date column adds Trends. A file without such columns still works, with the context answers of Kimola's Dimensions used as groups.
-
Will the same data always give the same Signals?
Yes. Kimola finds, scores and ranks Signals with deterministic statistical methods, so the same data gives the same Signals in the same order. Only the wording of each card is written by a language model, from numbers that are already computed.
-
Does AI decide what counts as a Signal?
No. A finding becomes a Signal only when it passes Kimola's statistical tests, corrected for the number of combinations tested. A language model then writes the card, and it cannot add findings, calculate numbers or suggest reasons customers didn't give. Cards whose quotes don't support the finding are hidden.
-
How do Signals relate to Action Plans?
Signals show where something stands out. Action Plans build on them to suggest what to do: Kimola forms hypotheses about what drives the Signals, checks them against the feedback and evidence in the report, and keeps only the recommendations the data supports.
Turn customer feedback into structured market research in 30+ languages—no AI training needed.
Create a Free Account No credit card · No commitment