Customer Feedback
Side by Side
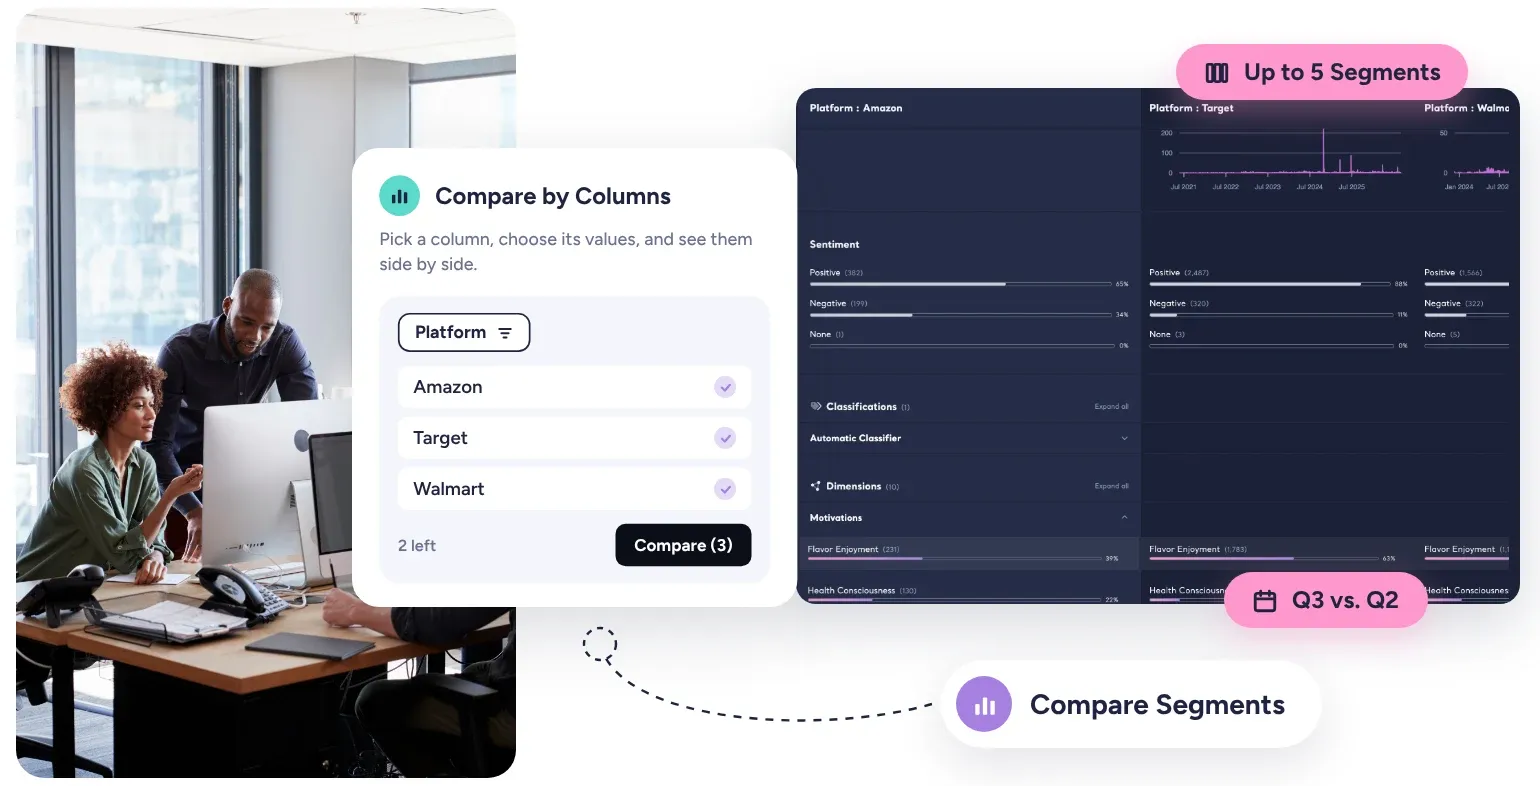
Kimola puts up to five products, regions, files or segments of your feedback side by side, across every theme, sentiment and Dimension it found.















3,000+ teams in more than 90 countries use Kimola.
Side by Side, Not Tab by Tab
Comparing two products or two regions usually means filtering for one, noting the numbers, filtering for the other and trying to remember what changed. Kimola starts from the segments already in your data instead.
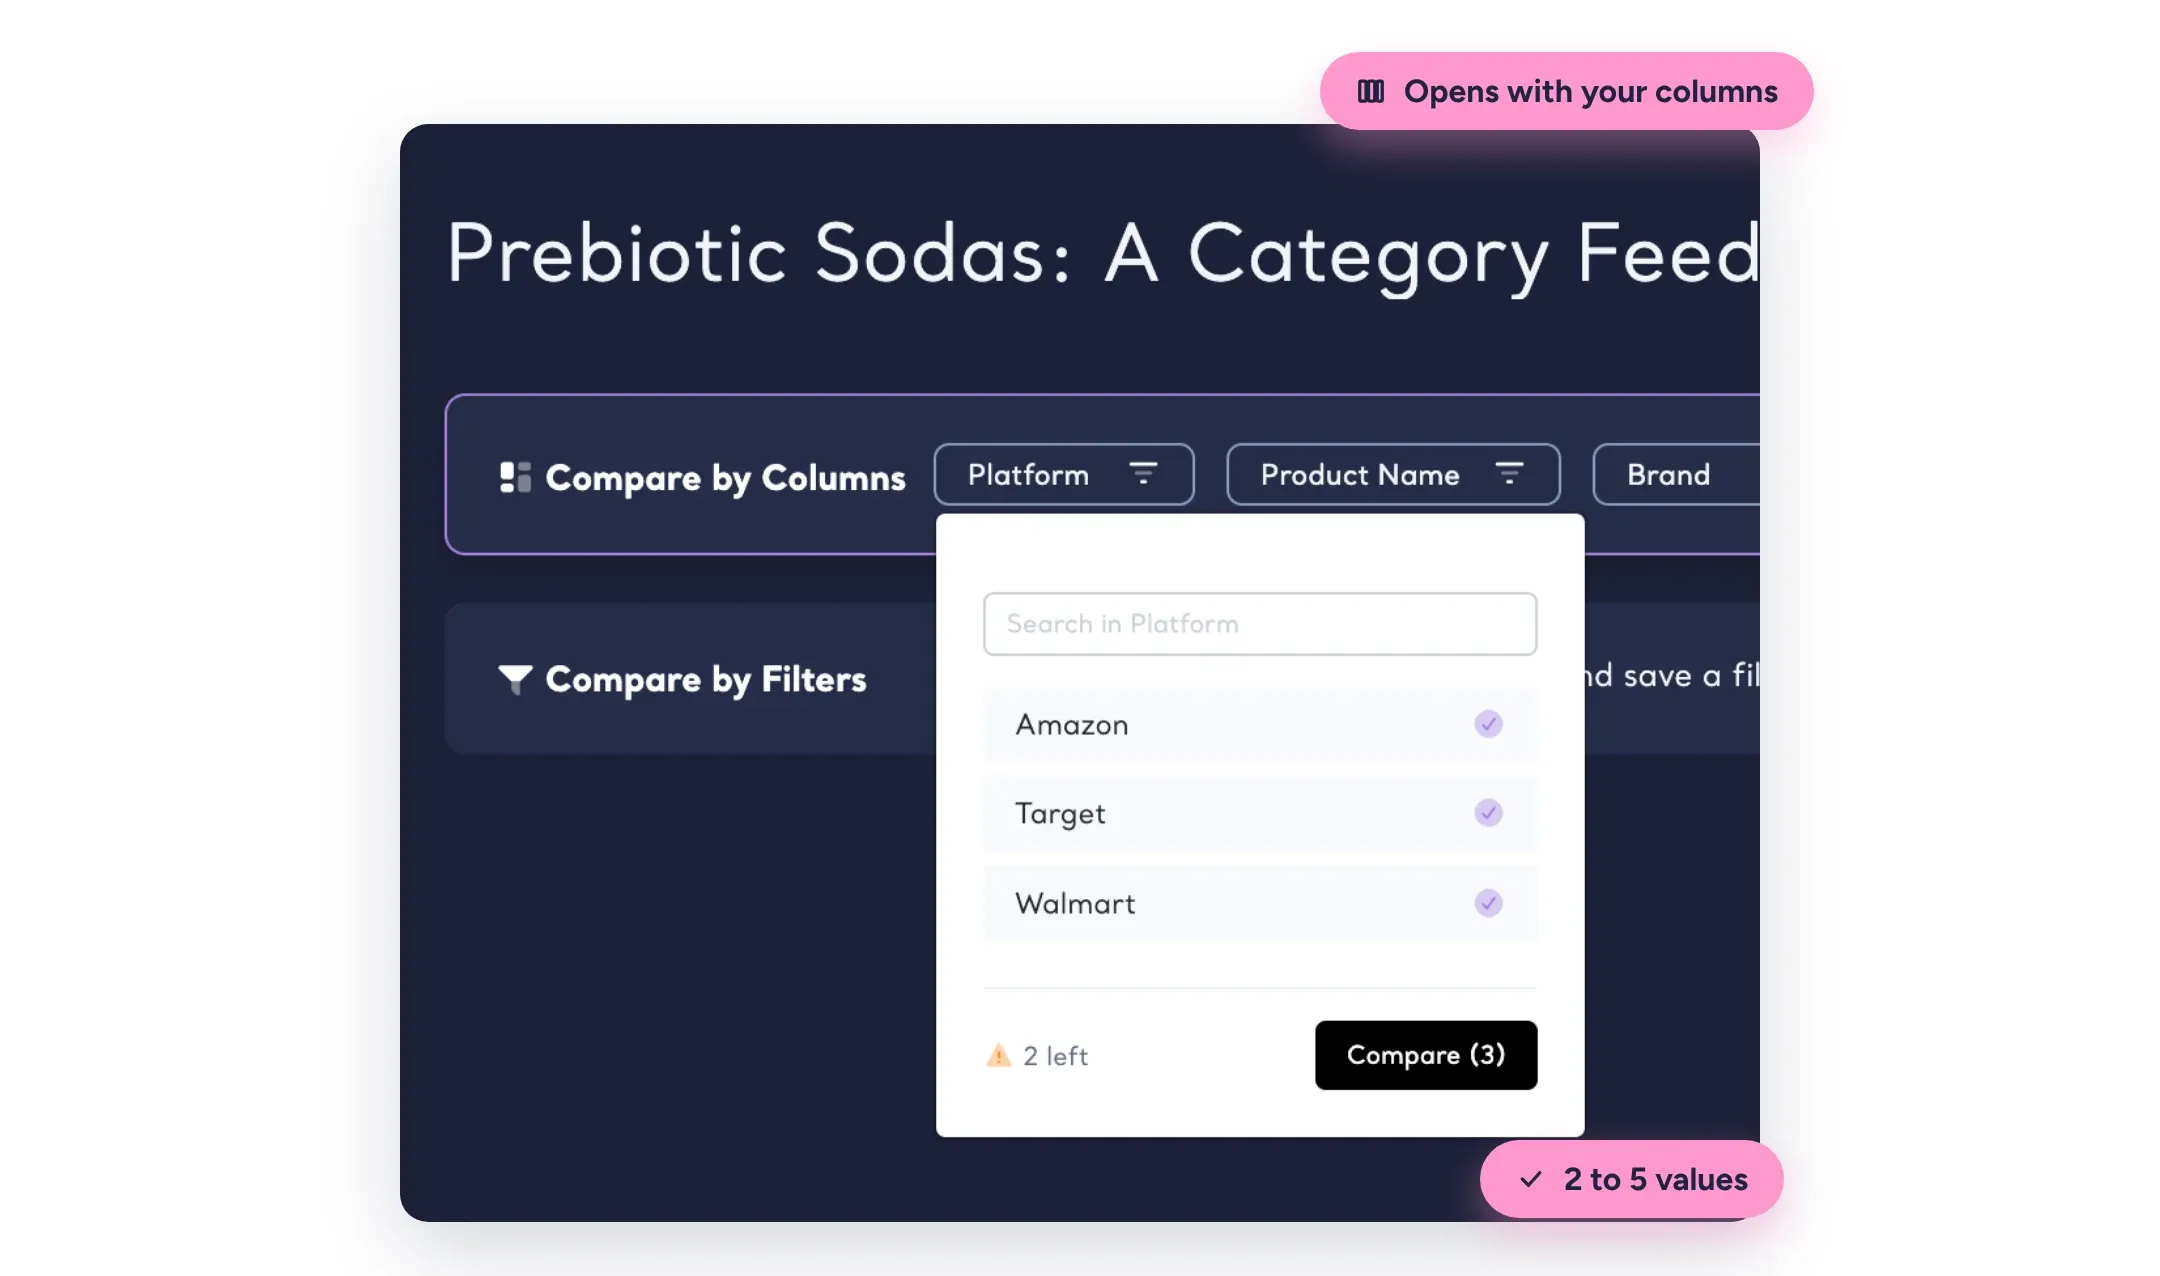
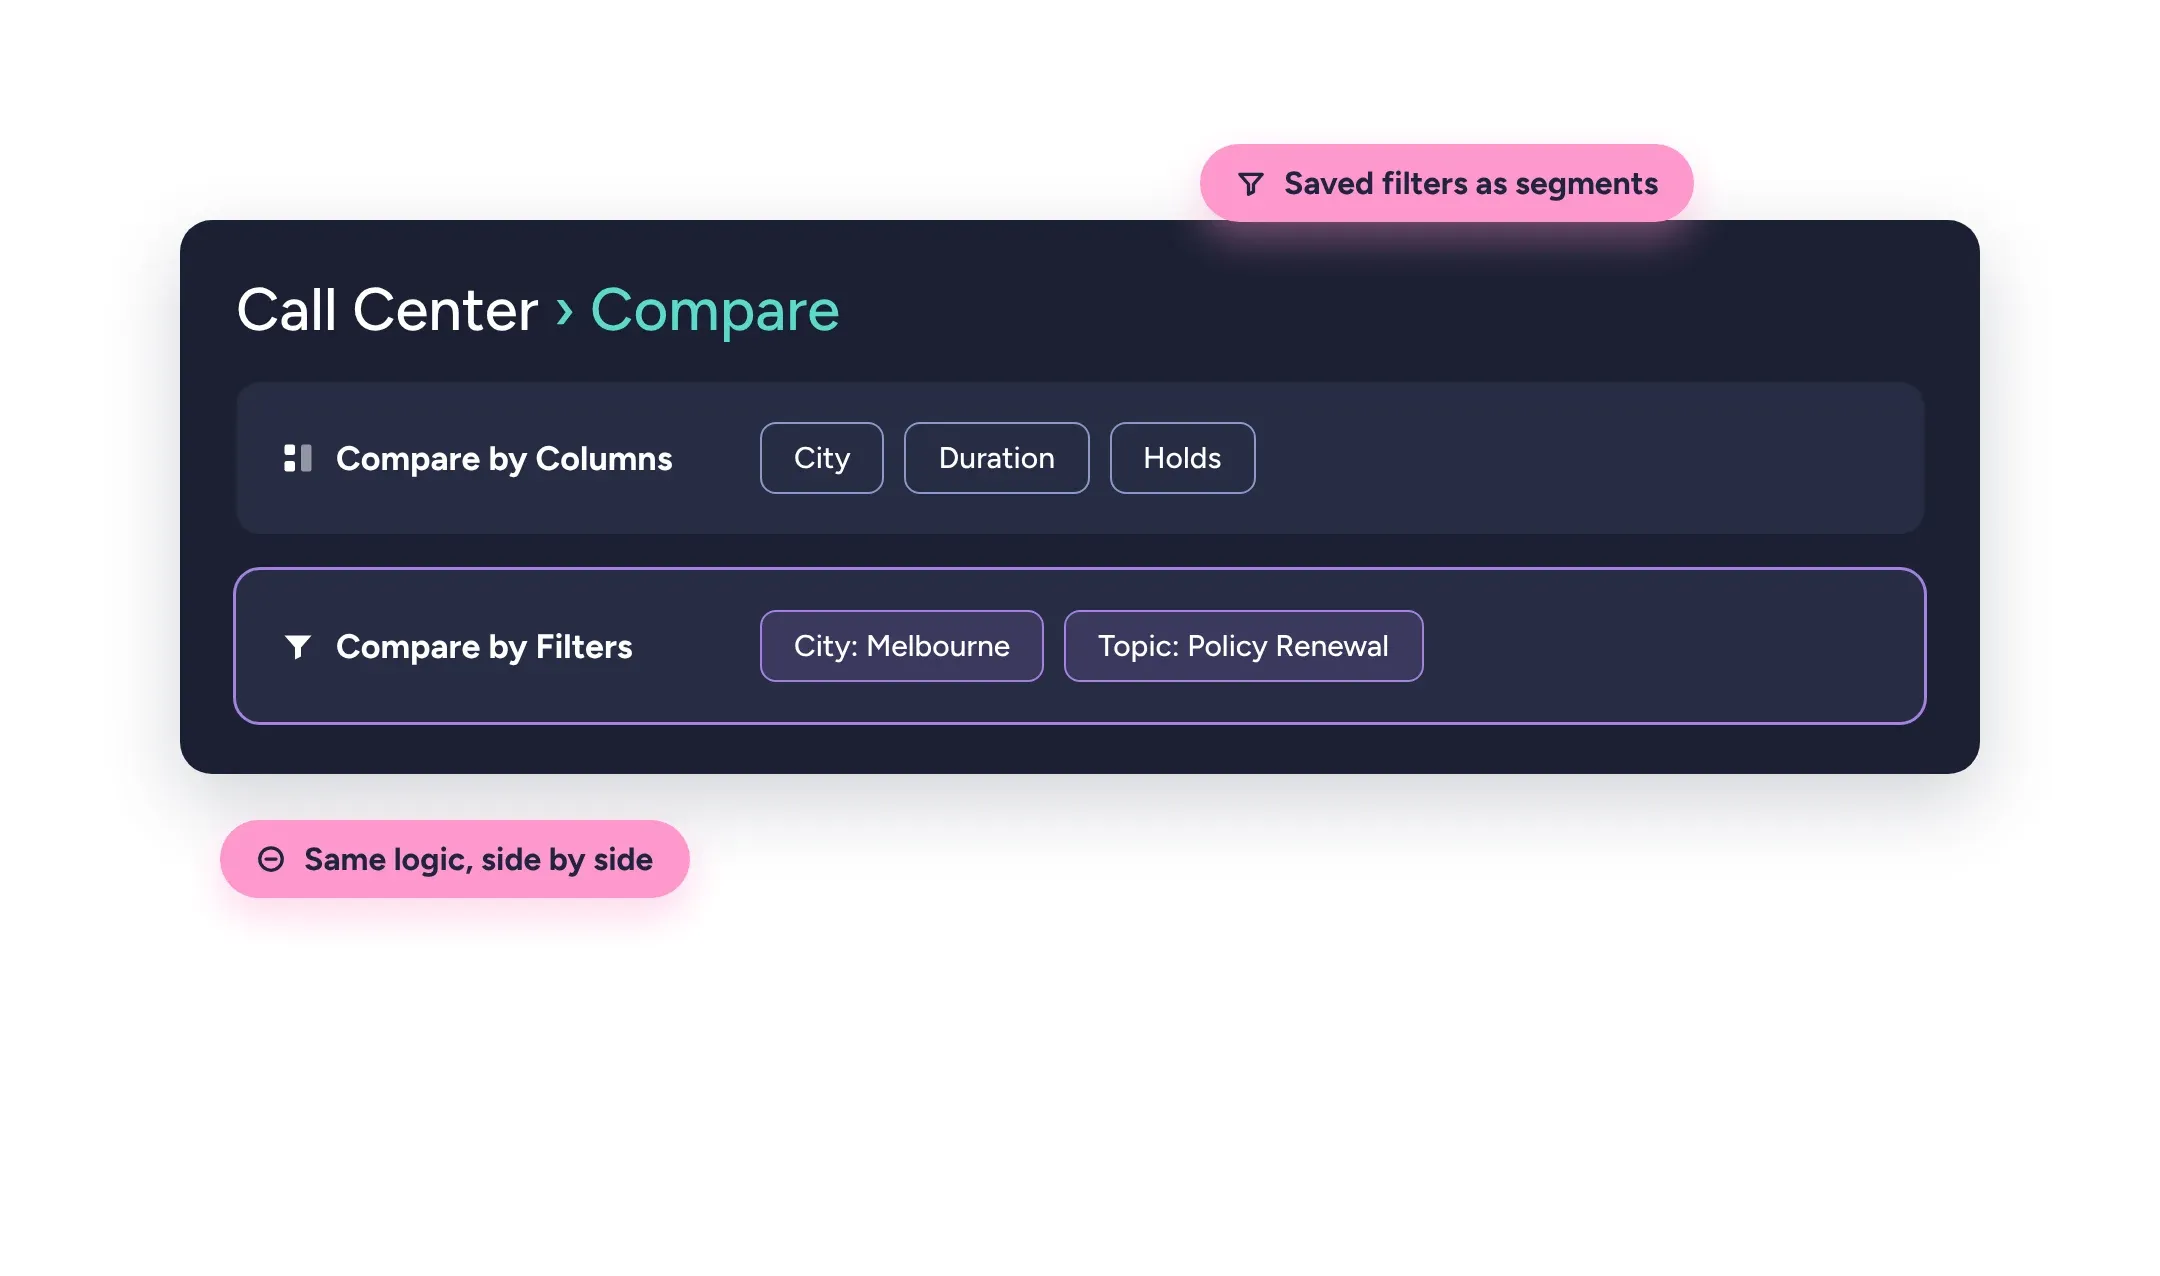
Compare opens with the columns of your dataset. Click a column and its values are listed, from the most frequent to every last one. Pick two to five values, such as products, stores, channels or customer types, and see them side by side on everything Kimola found in your feedback.
Every Result, for Every Segment
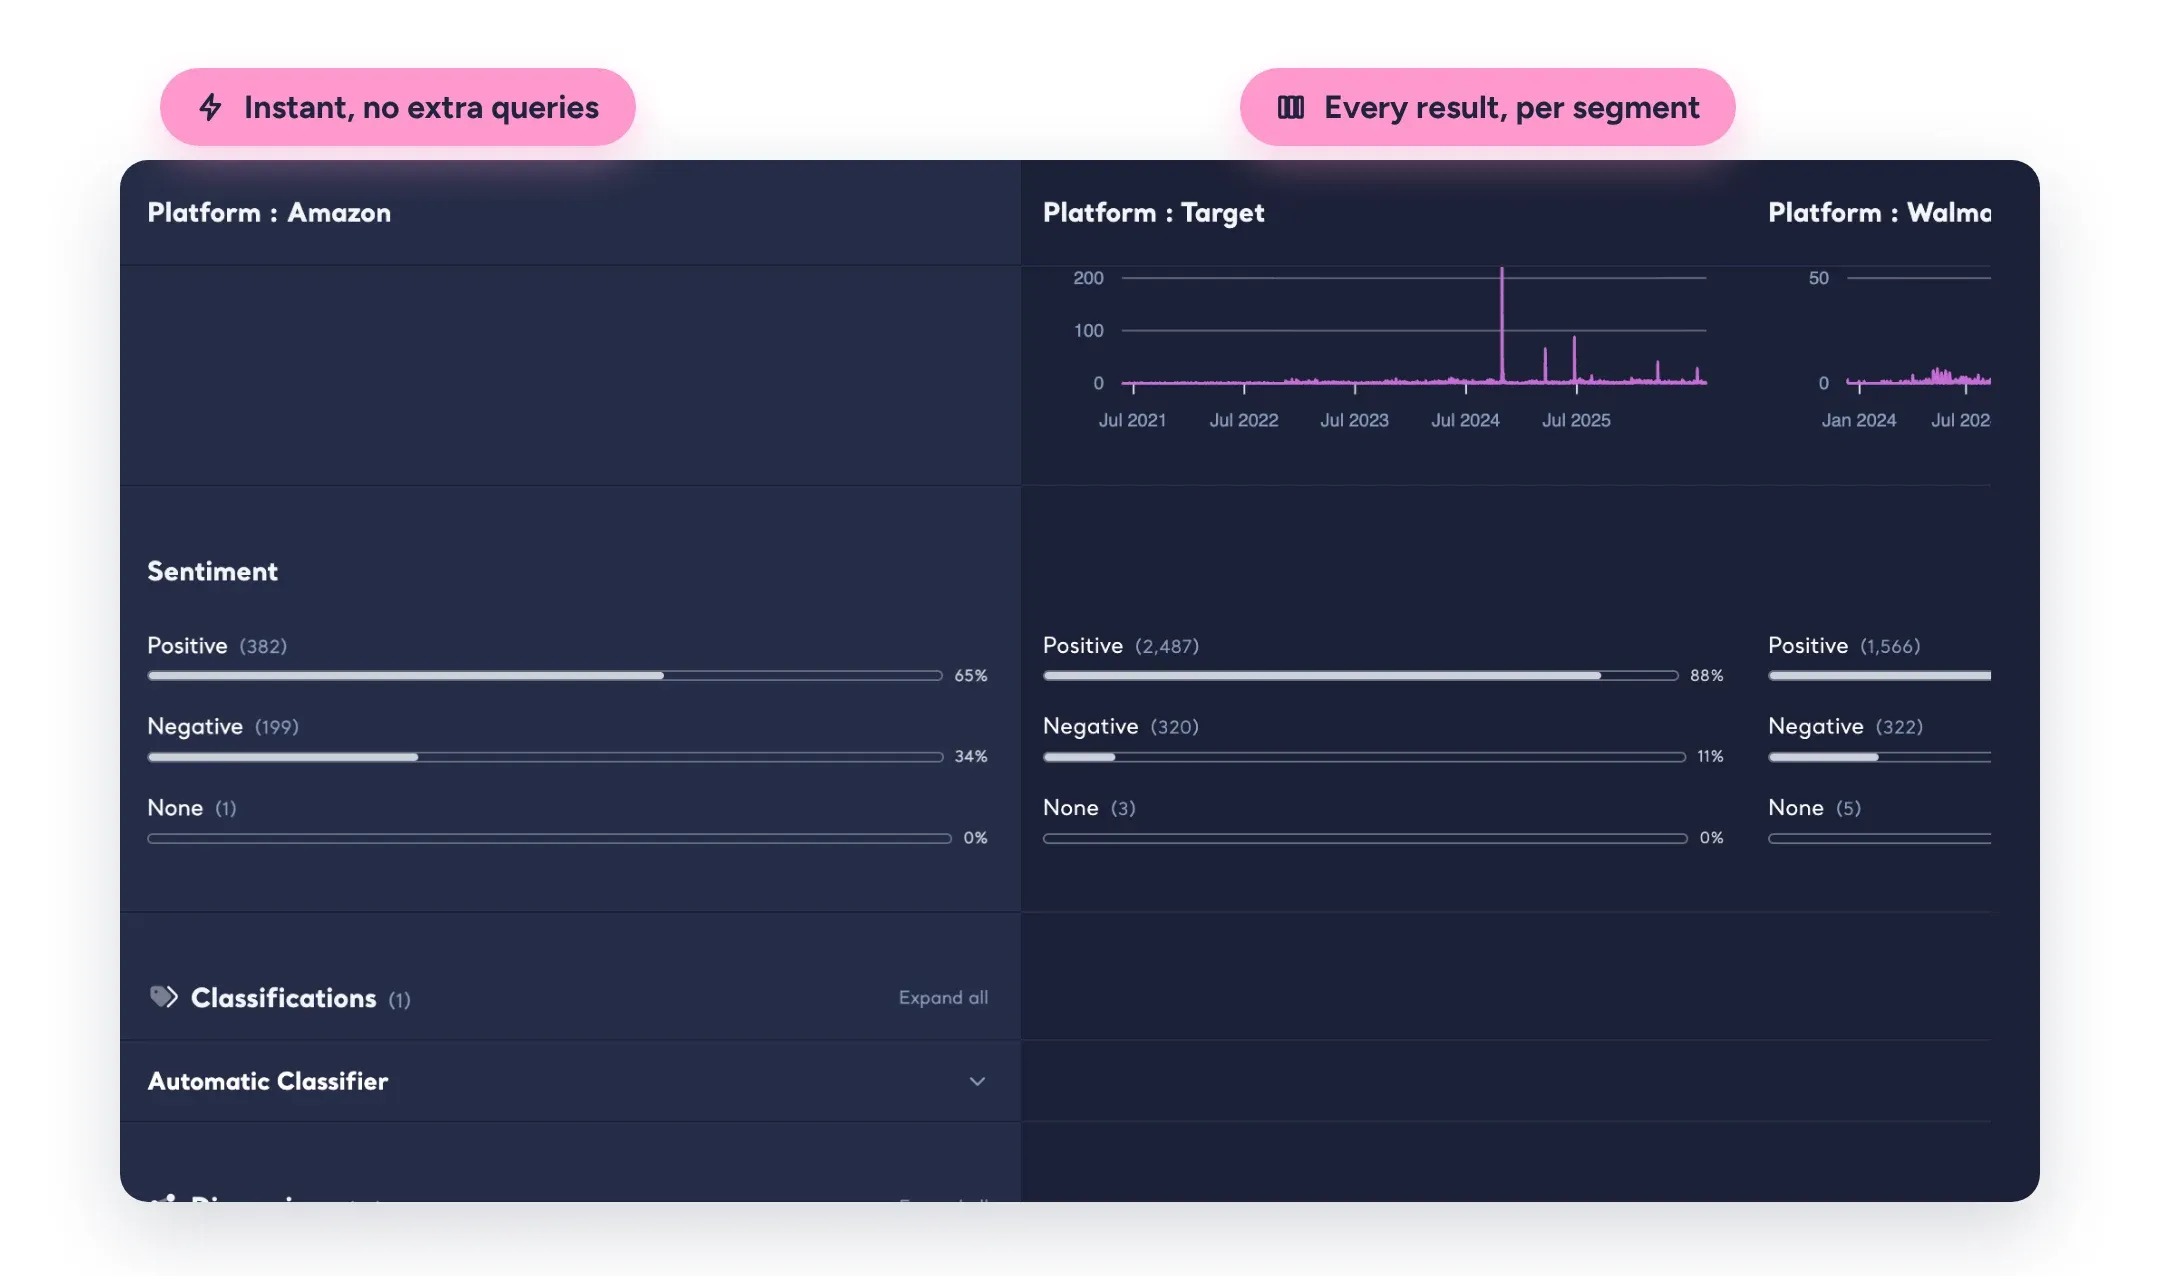
Each segment gets its own column: volume, sentiment, themes with their sentiment, Dimension answers, the words customers use most and the languages they write in. The same theme can be read across every segment in a single row.
Kimola also shows what only one segment talks about: a complaint unique to one store, or a strength only one product is praised for. Comparisons use the analysis that is already there, so they appear instantly and use no extra queries.
This Quarter Against the Last
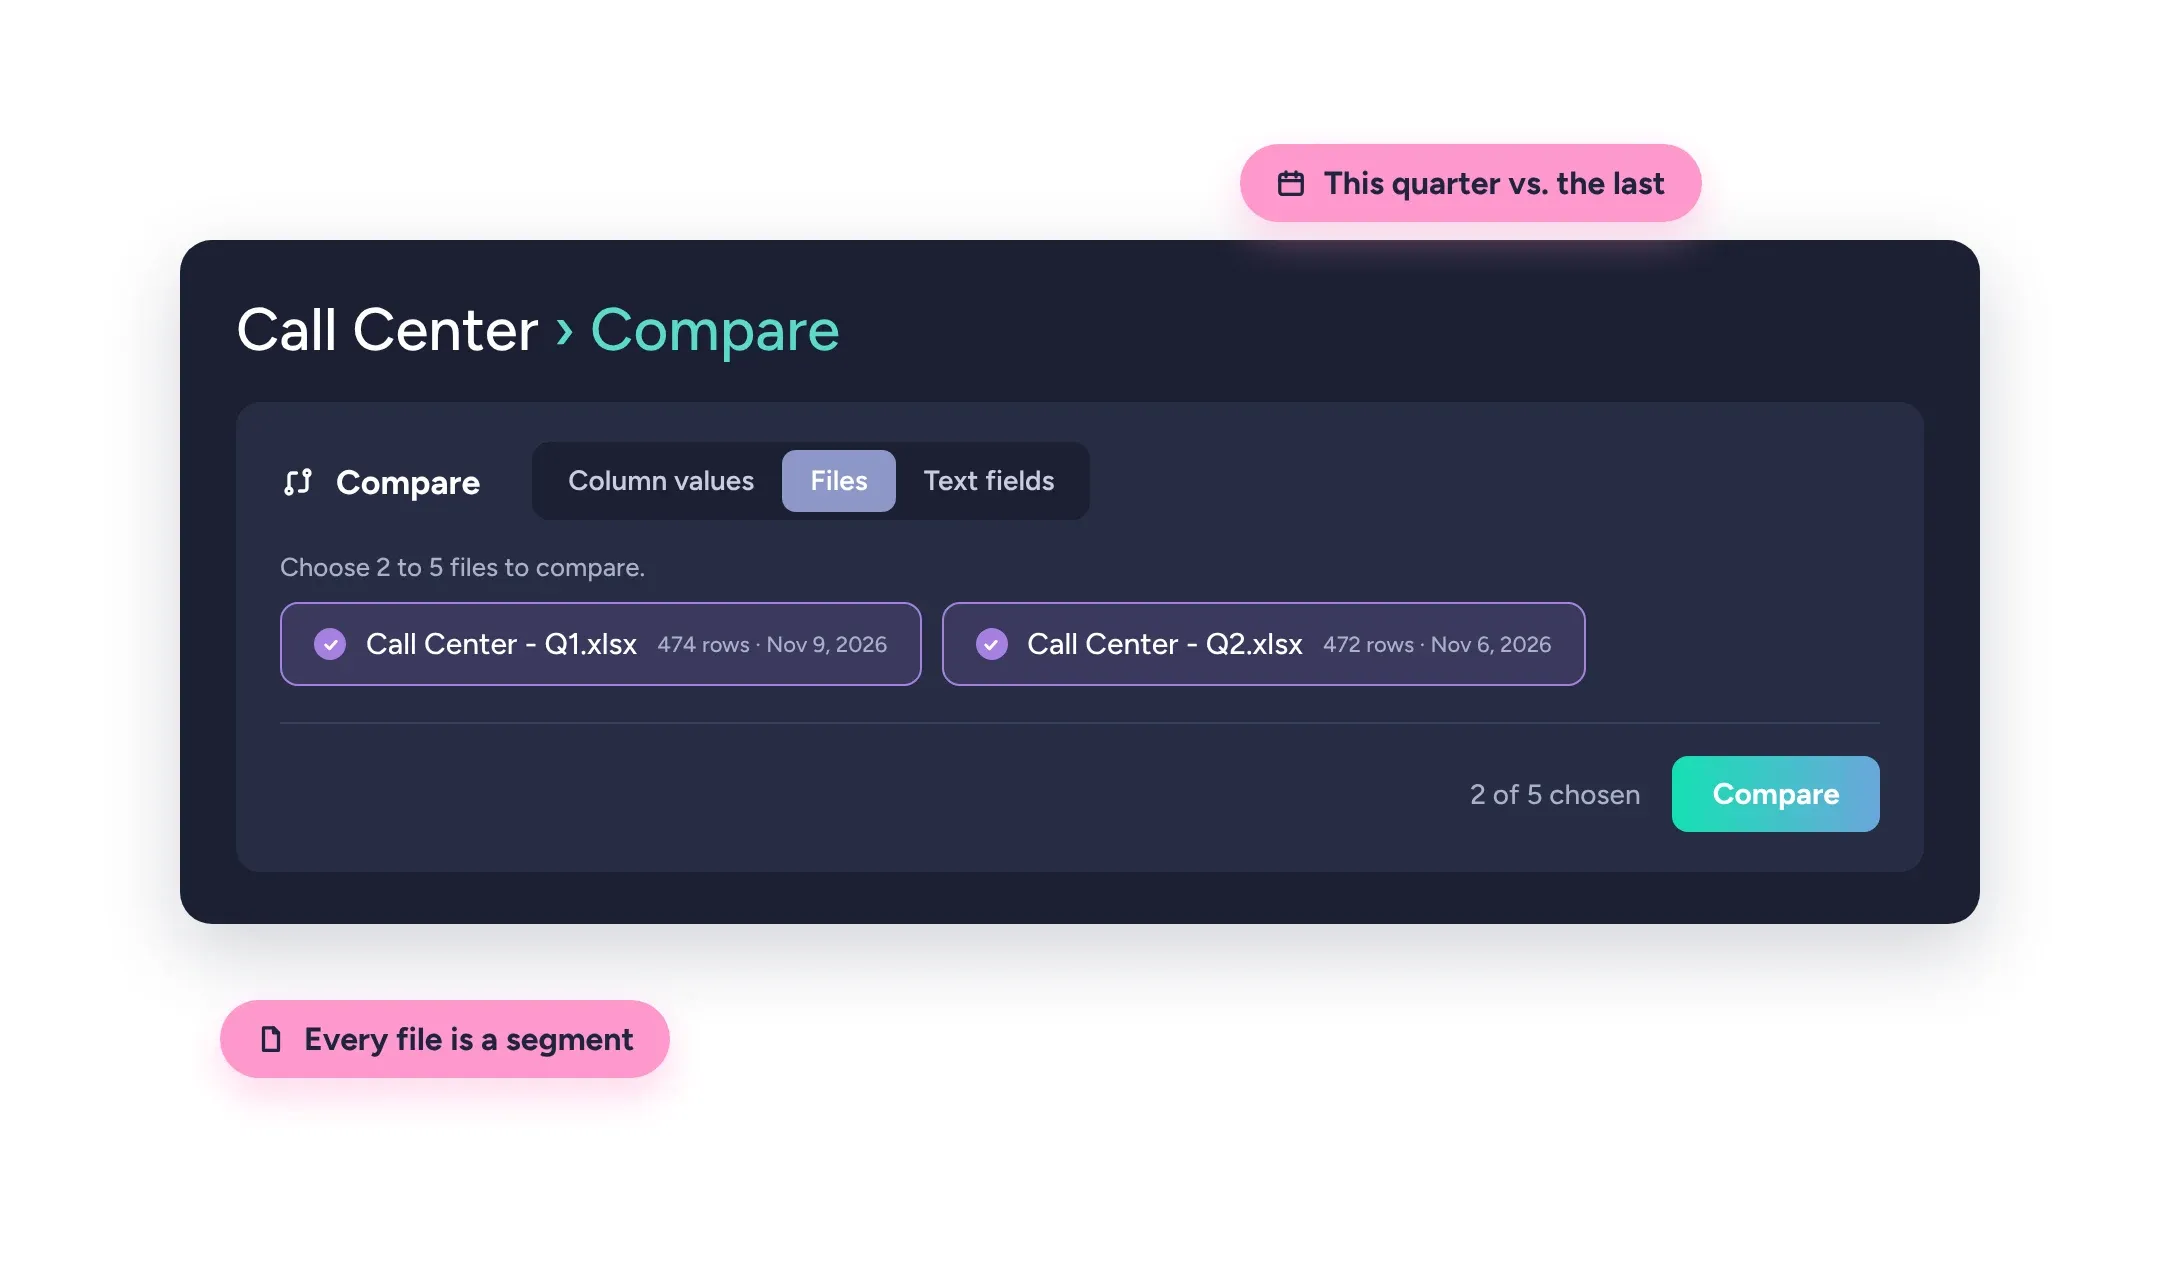
In a Space, feedback arrives file by file, and every file can be a segment. Put this quarter's upload next to the last one and the quarterly review is already written in the data: what customers raised again, what disappeared and what is new.
A Space can also compare text fields, such as the answers to two open-ended questions of the same survey. Filters apply to every segment at once: filter by a theme like late delivery, compare your regions, and you see which regions complain about it, and how.
Segments You Define
A segment doesn't have to be a single column value. In a Report, any saved filter can be compared, so segments built from scores, sentiment, themes or languages line up with the same logic. Save one filter for survey scores of 9 and 10 and another for 0 to 6, and you read what promoters and detractors write, side by side.
Compare in Spaces is part of the Enterprise package and Kimola On-Premises.
Related: Compare Feature on Reports
Bring the feedback you already have.
Organize feedback like a research team.
See the people behind the feedback.
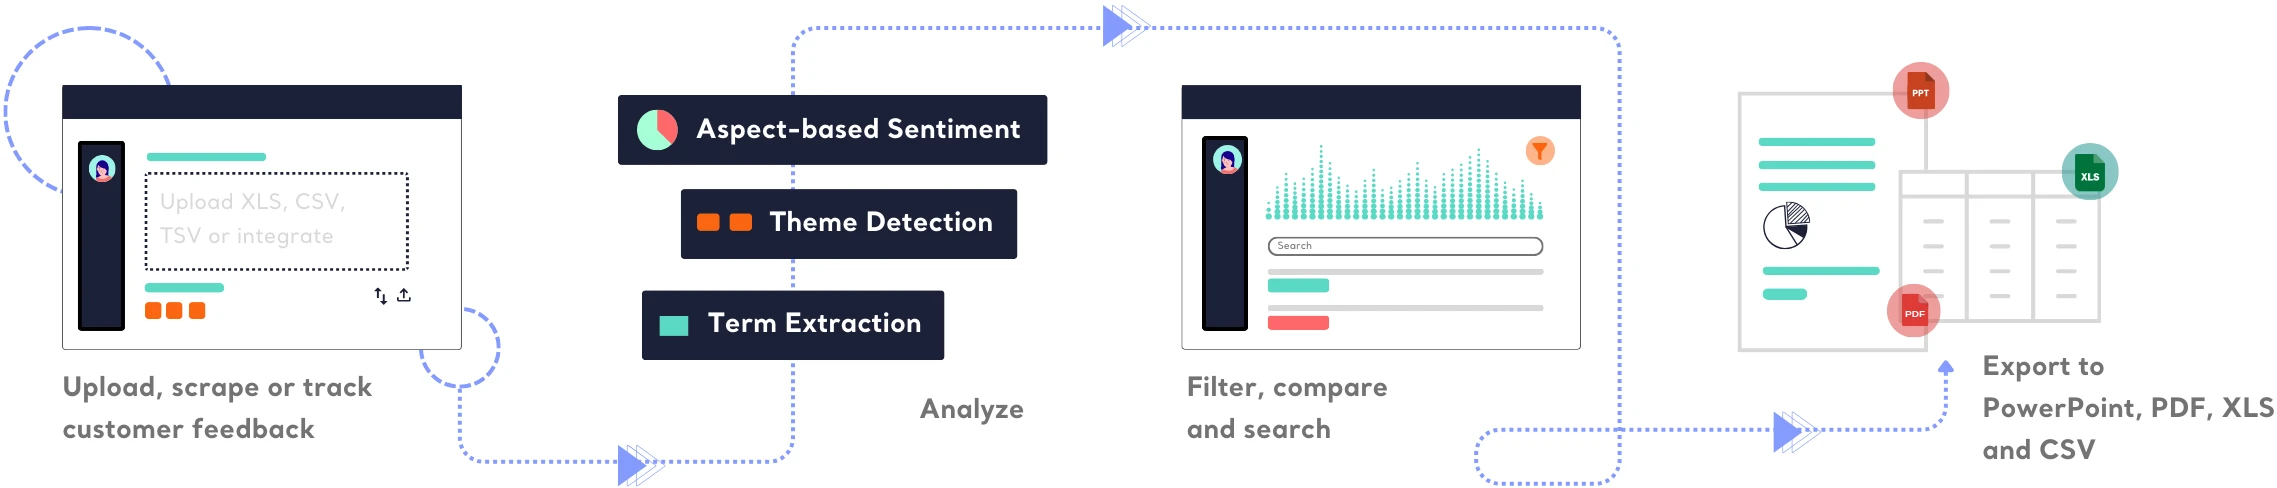
See how teams turn different kinds of feedback into research.






Frequently Asked Questions
About Compare Segments
-
What can I compare?
The values of any column in your data, such as products, regions, stores or survey scores. In a Report, you can also compare saved filters. In a Space, you can compare files, such as this month's upload and last month's, and text fields, such as two open-ended survey questions.
-
How many segments can I compare at once?
From two to five. Each segment gets its own column, and the first one you pick stays in place while you scroll through the others.
-
Does comparing segments use extra queries?
No. Compare reads the analysis that is already done, so it doesn't run a new analysis and doesn't consume queries. You can compare as many combinations as you like.
-
Can I compare this quarter's feedback with last quarter's?
Yes. In a Space, every uploaded file can be a segment, so two quarterly files can be compared directly. If your data has a date or period column, its values can be compared in a Report as well.
-
How is Compare different from Pivot Tables?
Pivot Tables cross two fields and show every combination of their values with volume and sentiment. Compare takes a few chosen segments and shows the full analysis for each, from themes to Dimension answers.
-
How does Compare relate to Signals?
Signals test every segment for you and tell you which one stands apart, and on what. Compare lets you look at the segments you choose in full, side by side, when you want to see the whole picture rather than one finding.
Turn customer feedback into structured market research in 30+ languages—no AI training needed.
Create a Free Account No credit card · No commitment