Cross-Tab Customer Feedback
Without Leaving Kimola
Kimola crosses your own columns with its themes, sentiment and Dimensions, and averages any number in your data, without a single Excel formula.















3,000+ teams in more than 90 countries use Kimola.
The Question a Spreadsheet Makes Hard
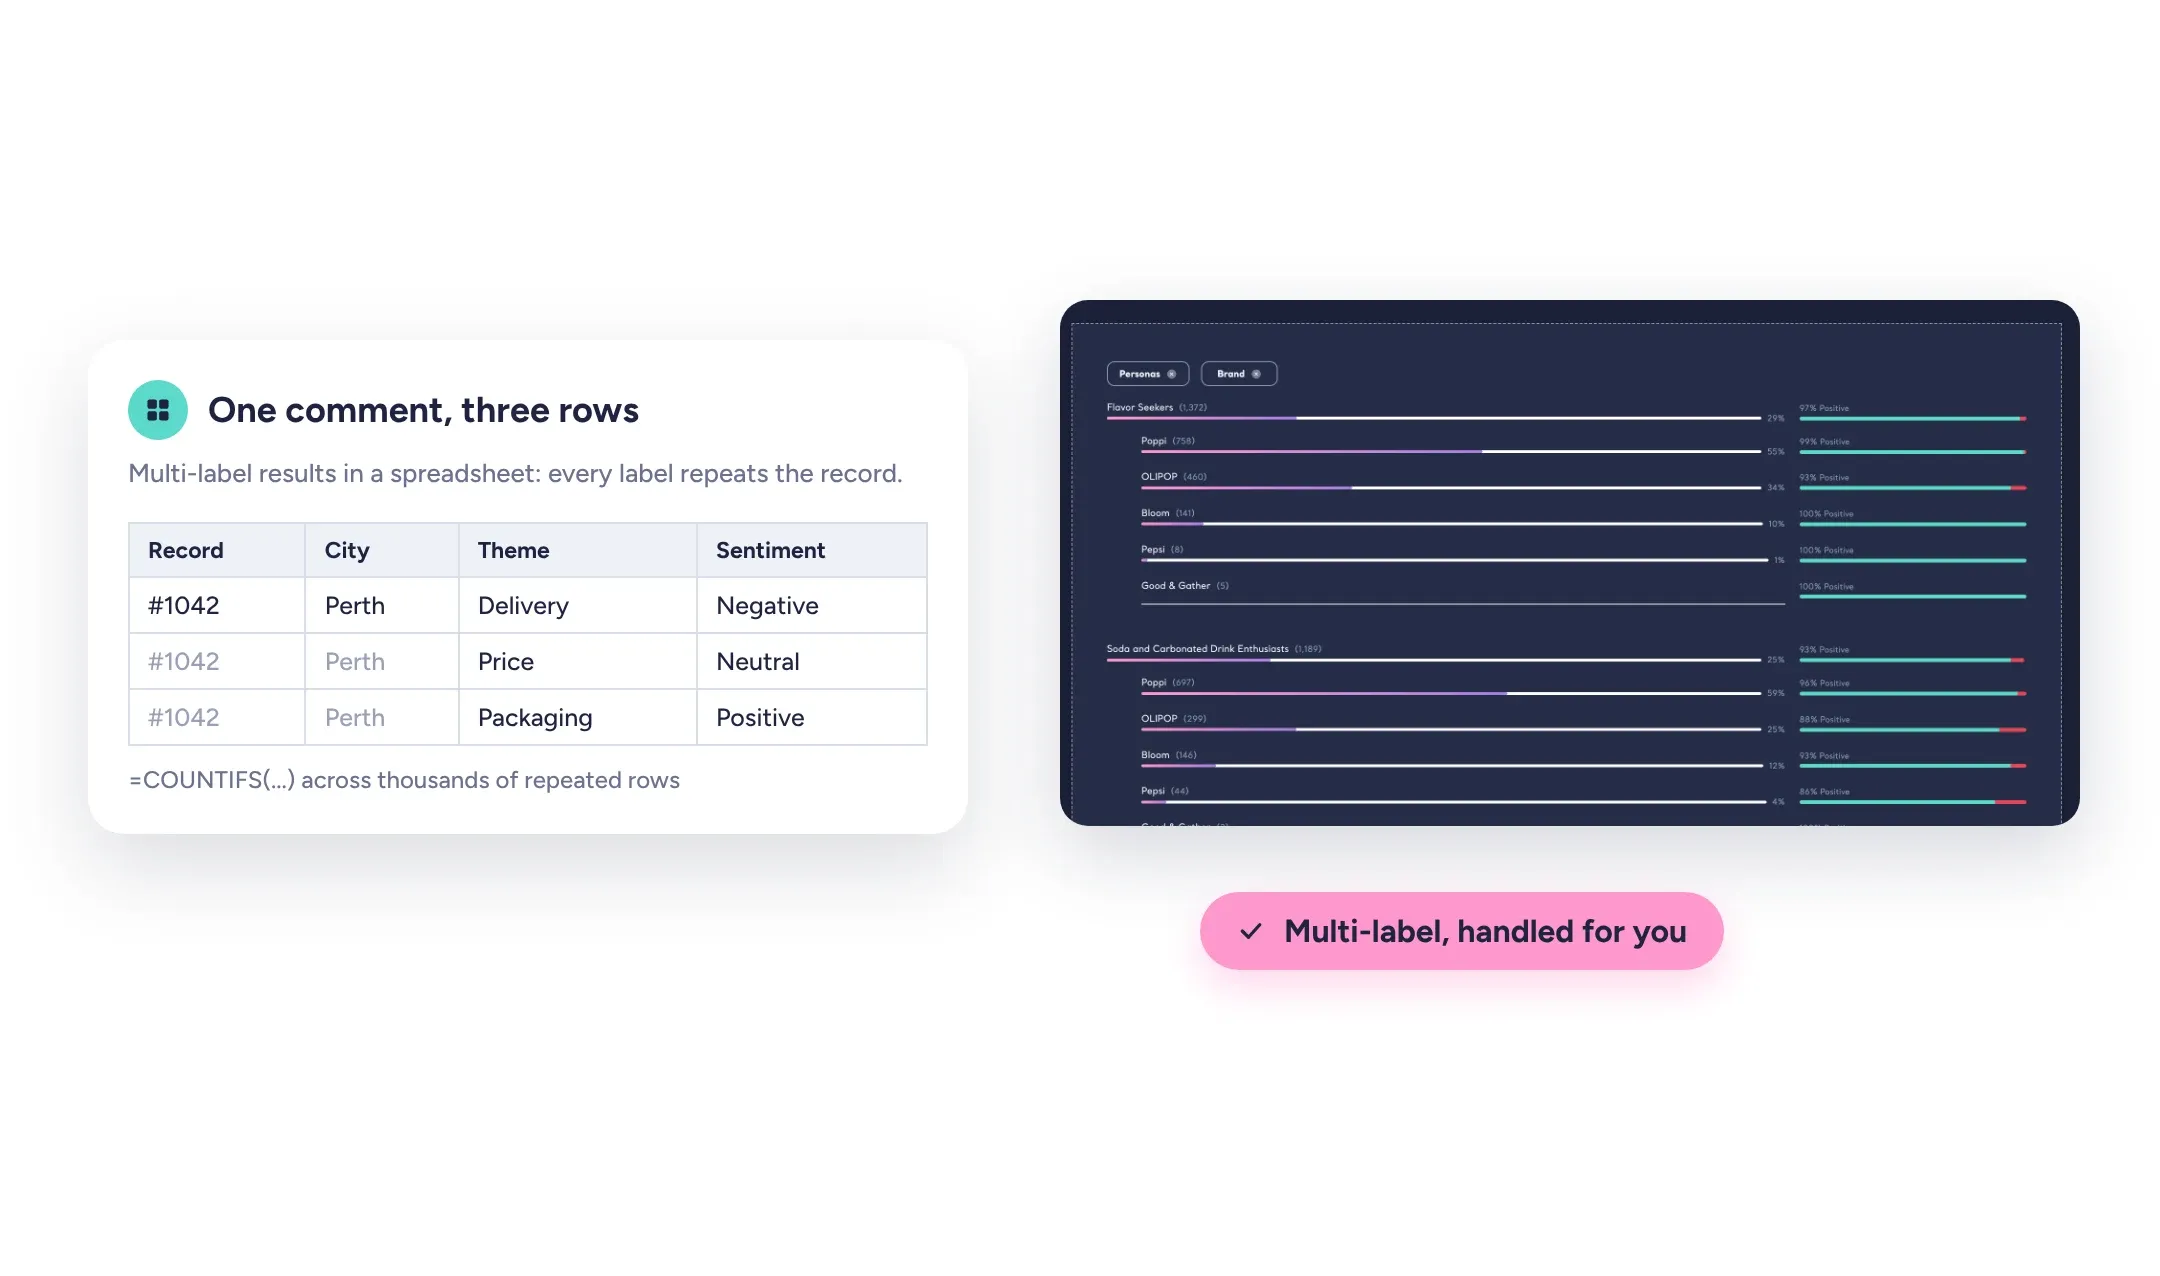
Customer feedback rarely fits one label. A single comment can mention delivery, price and packaging, carry a sentiment for each and answer several Dimensions at once. That is what makes it rich, and also what makes it hard to cross-tab in a spreadsheet: every label needs a row of its own, and the formulas get out of hand long before the questions do.
Kimola does that work for you. Pivot Tables sit inside the product, on top of the analysis, so your questions don't wait for an export and an analyst.
Your Columns, Crossed With Kimola's Analysis
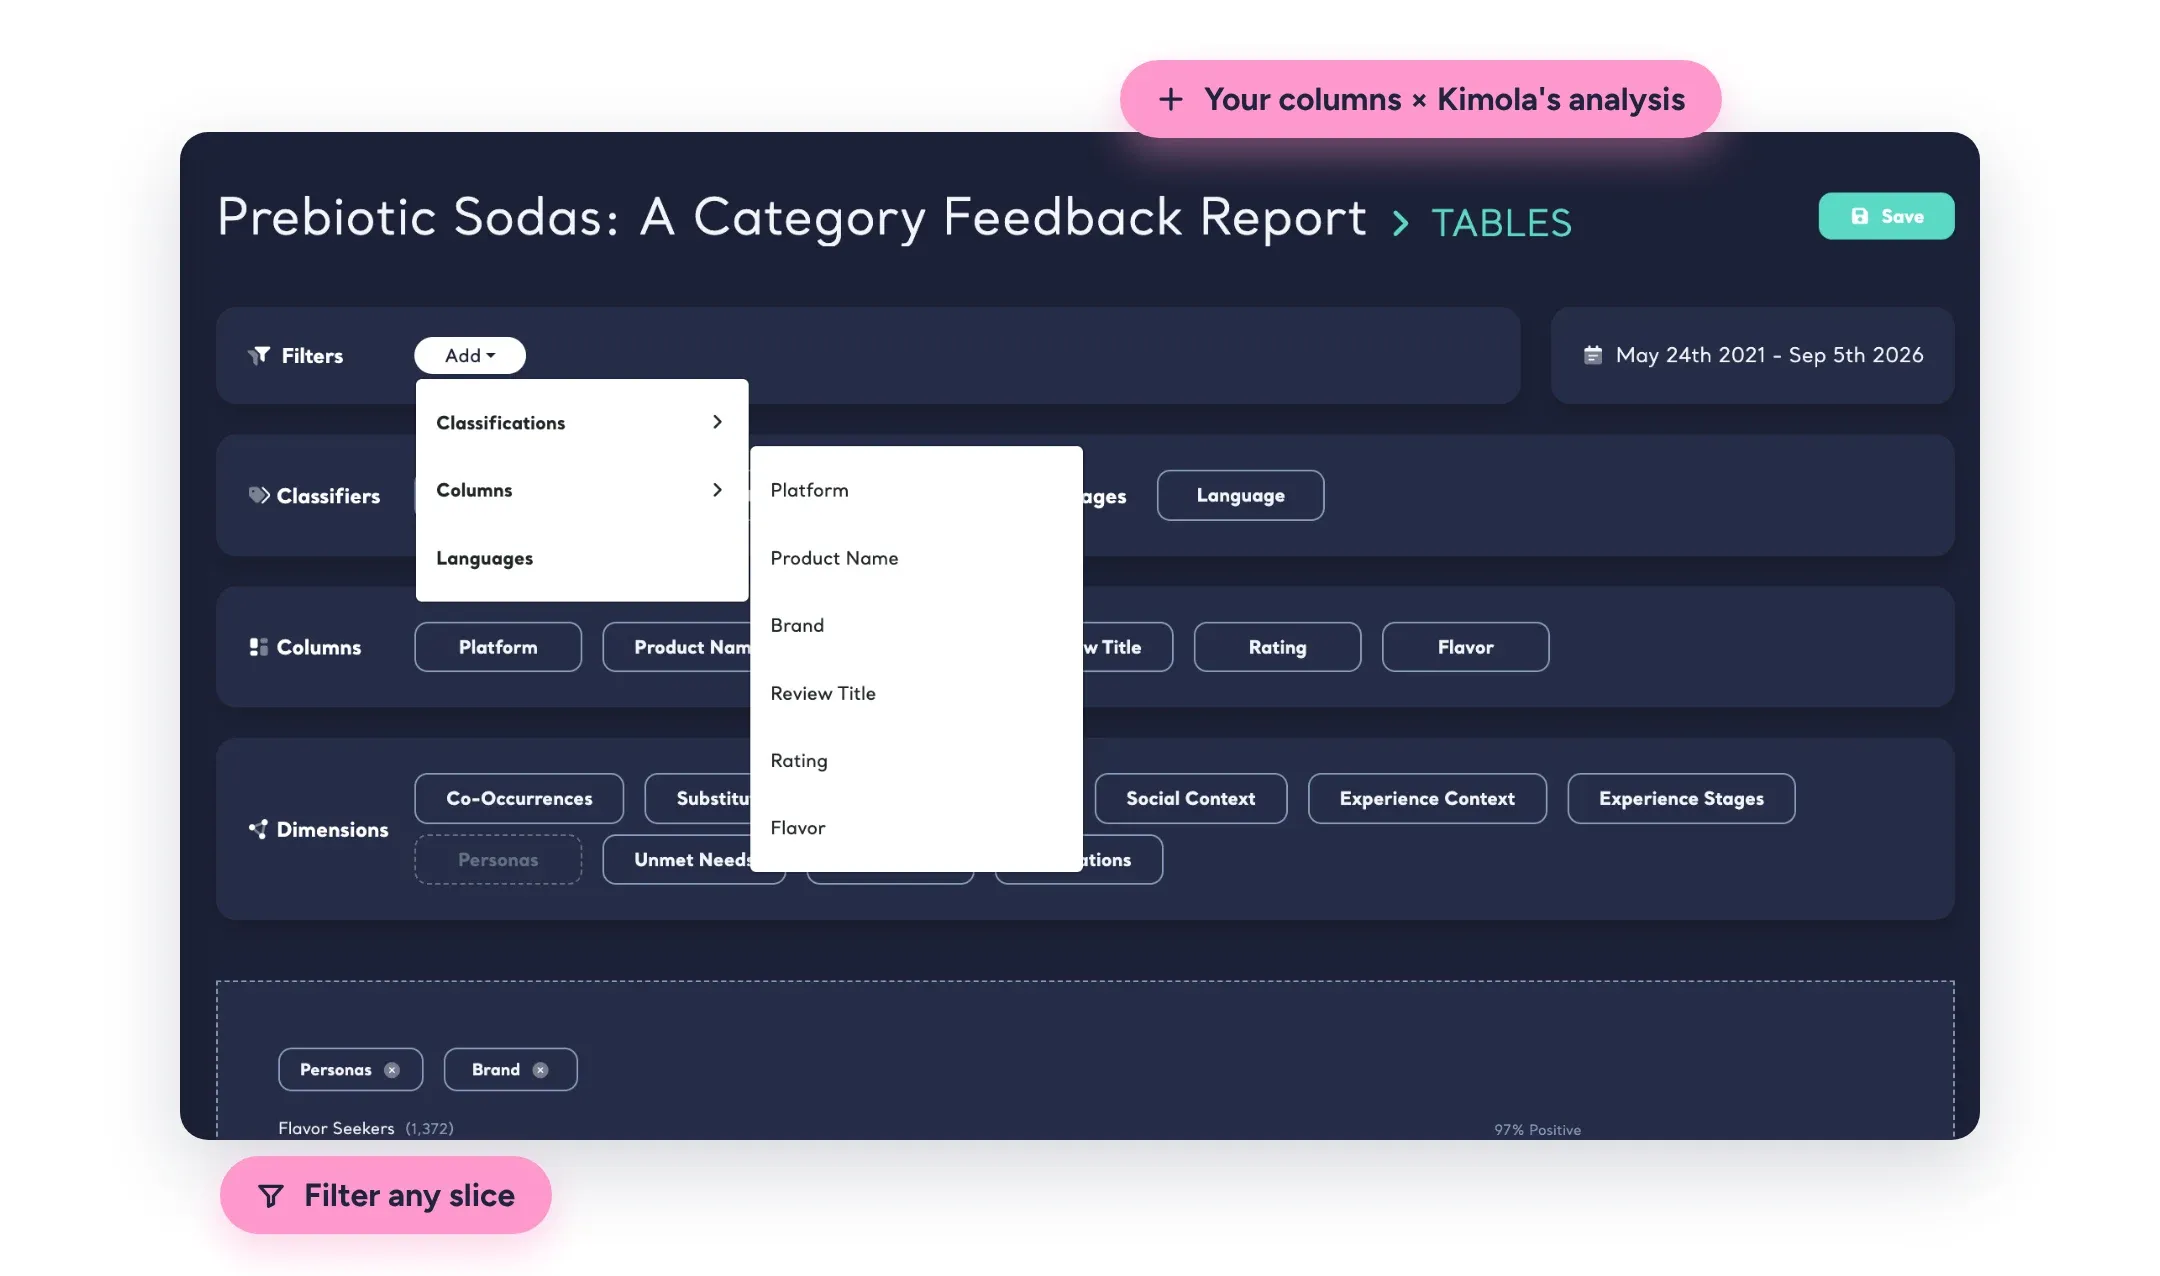
Any column you uploaded, such as city, segment, product or sales rep, can be crossed with anything Kimola found: themes, sentiment, Dimension answers and even the language of the feedback. Which personas come from which city? Which experience stages trouble which segment? Every answer is sorted by volume, with its sentiment on every row.
Filters narrow the question further. Look only at positive feedback, at a single period, or at the survey answers collected by one sales rep, and the table is rebuilt from those records alone.
Numbers, Not Just Counts
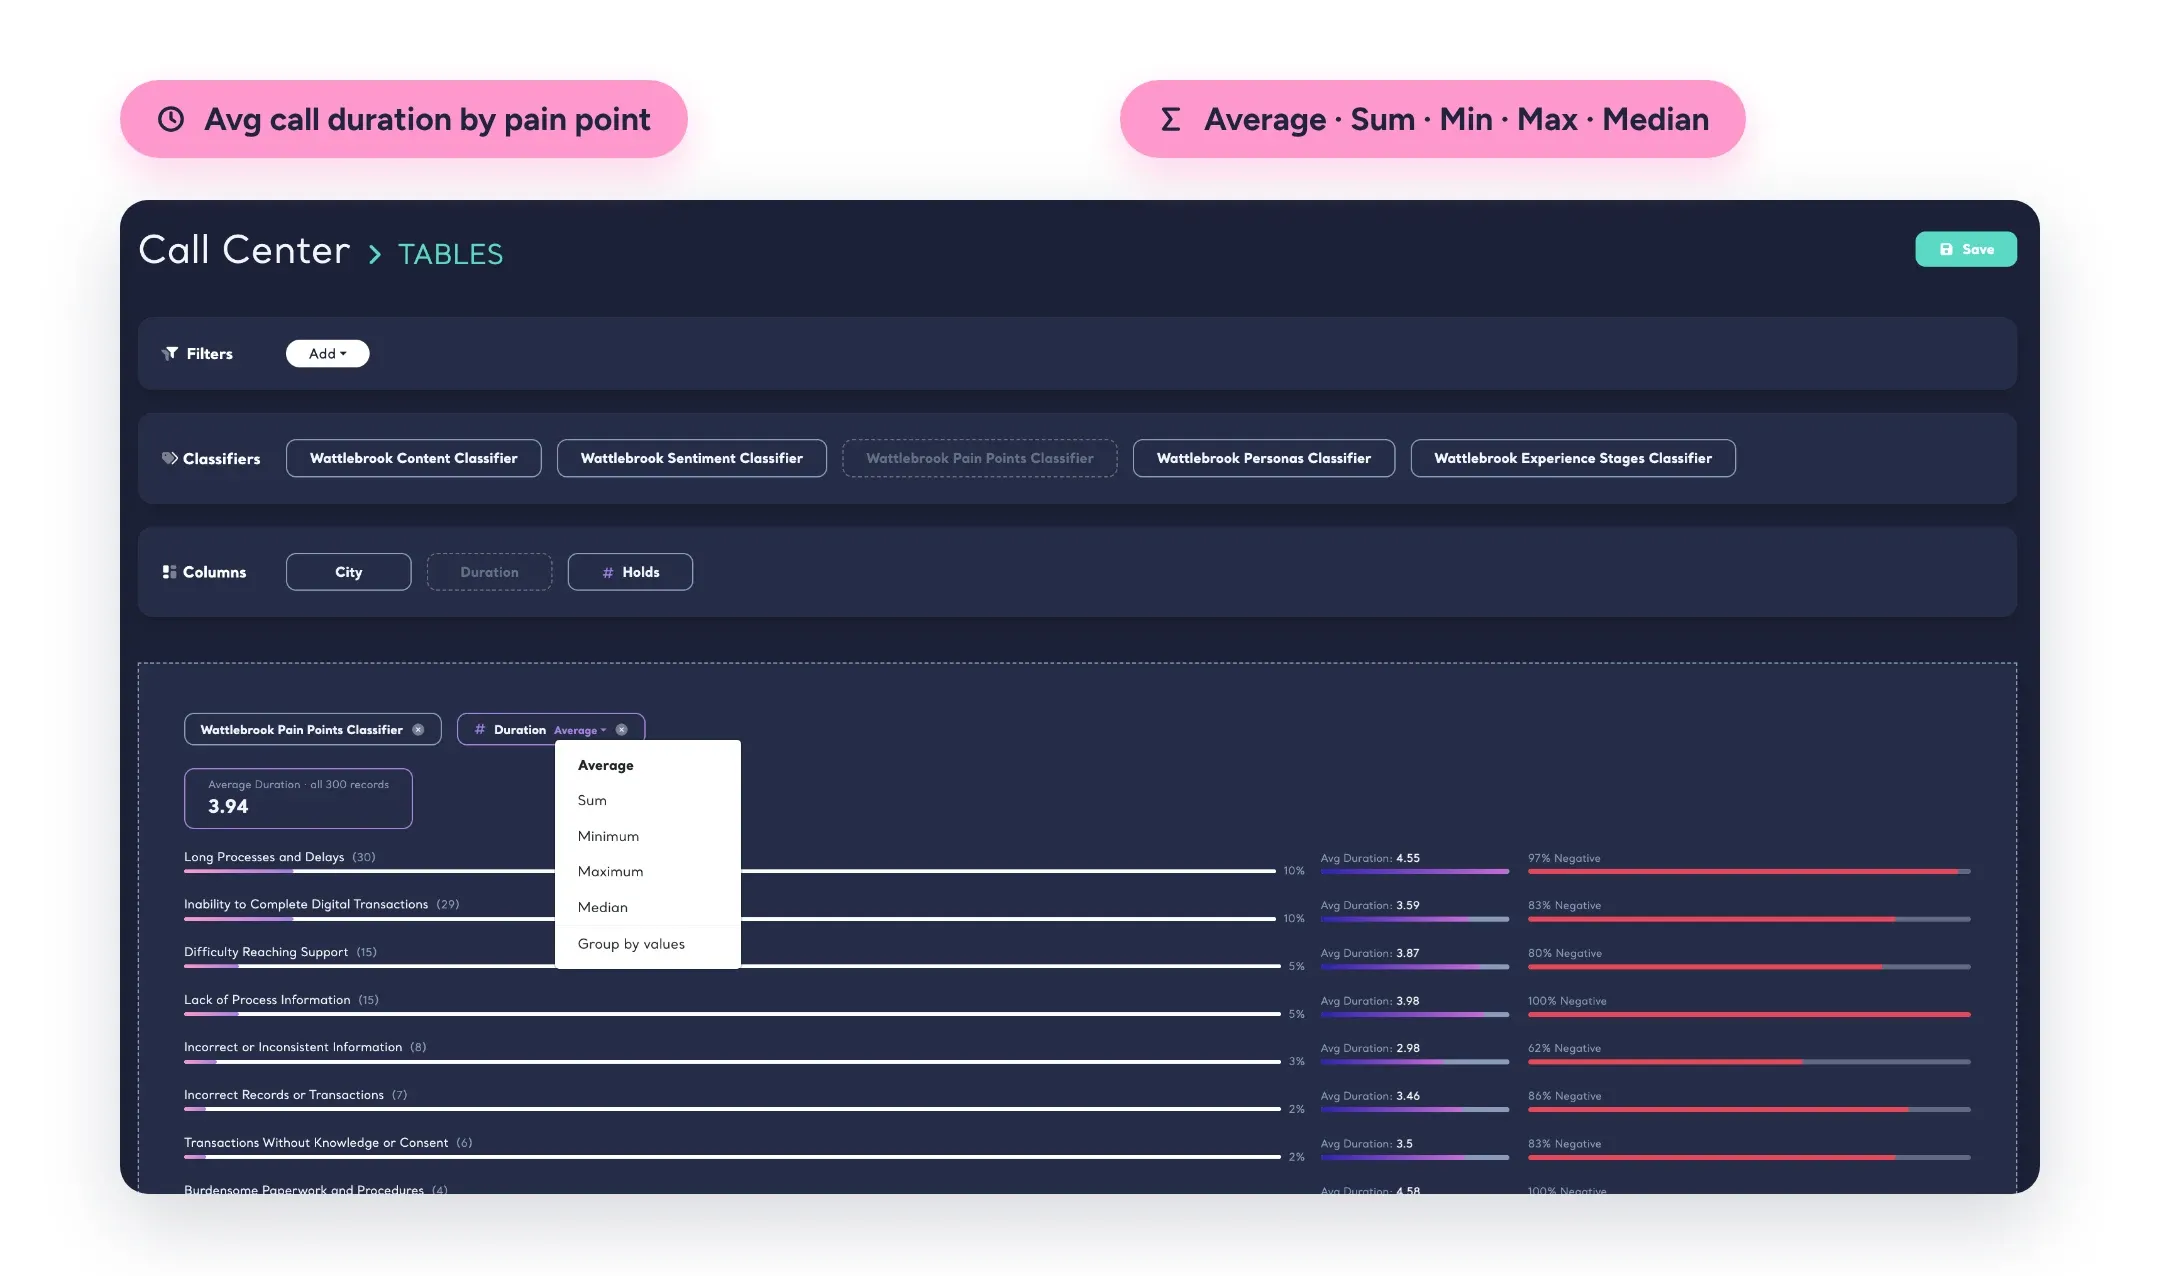
Kimola detects the type of every column in your data. When a column holds numbers, such as call duration, order value or a satisfaction score, Pivot Tables can average, sum or count it across any combination.
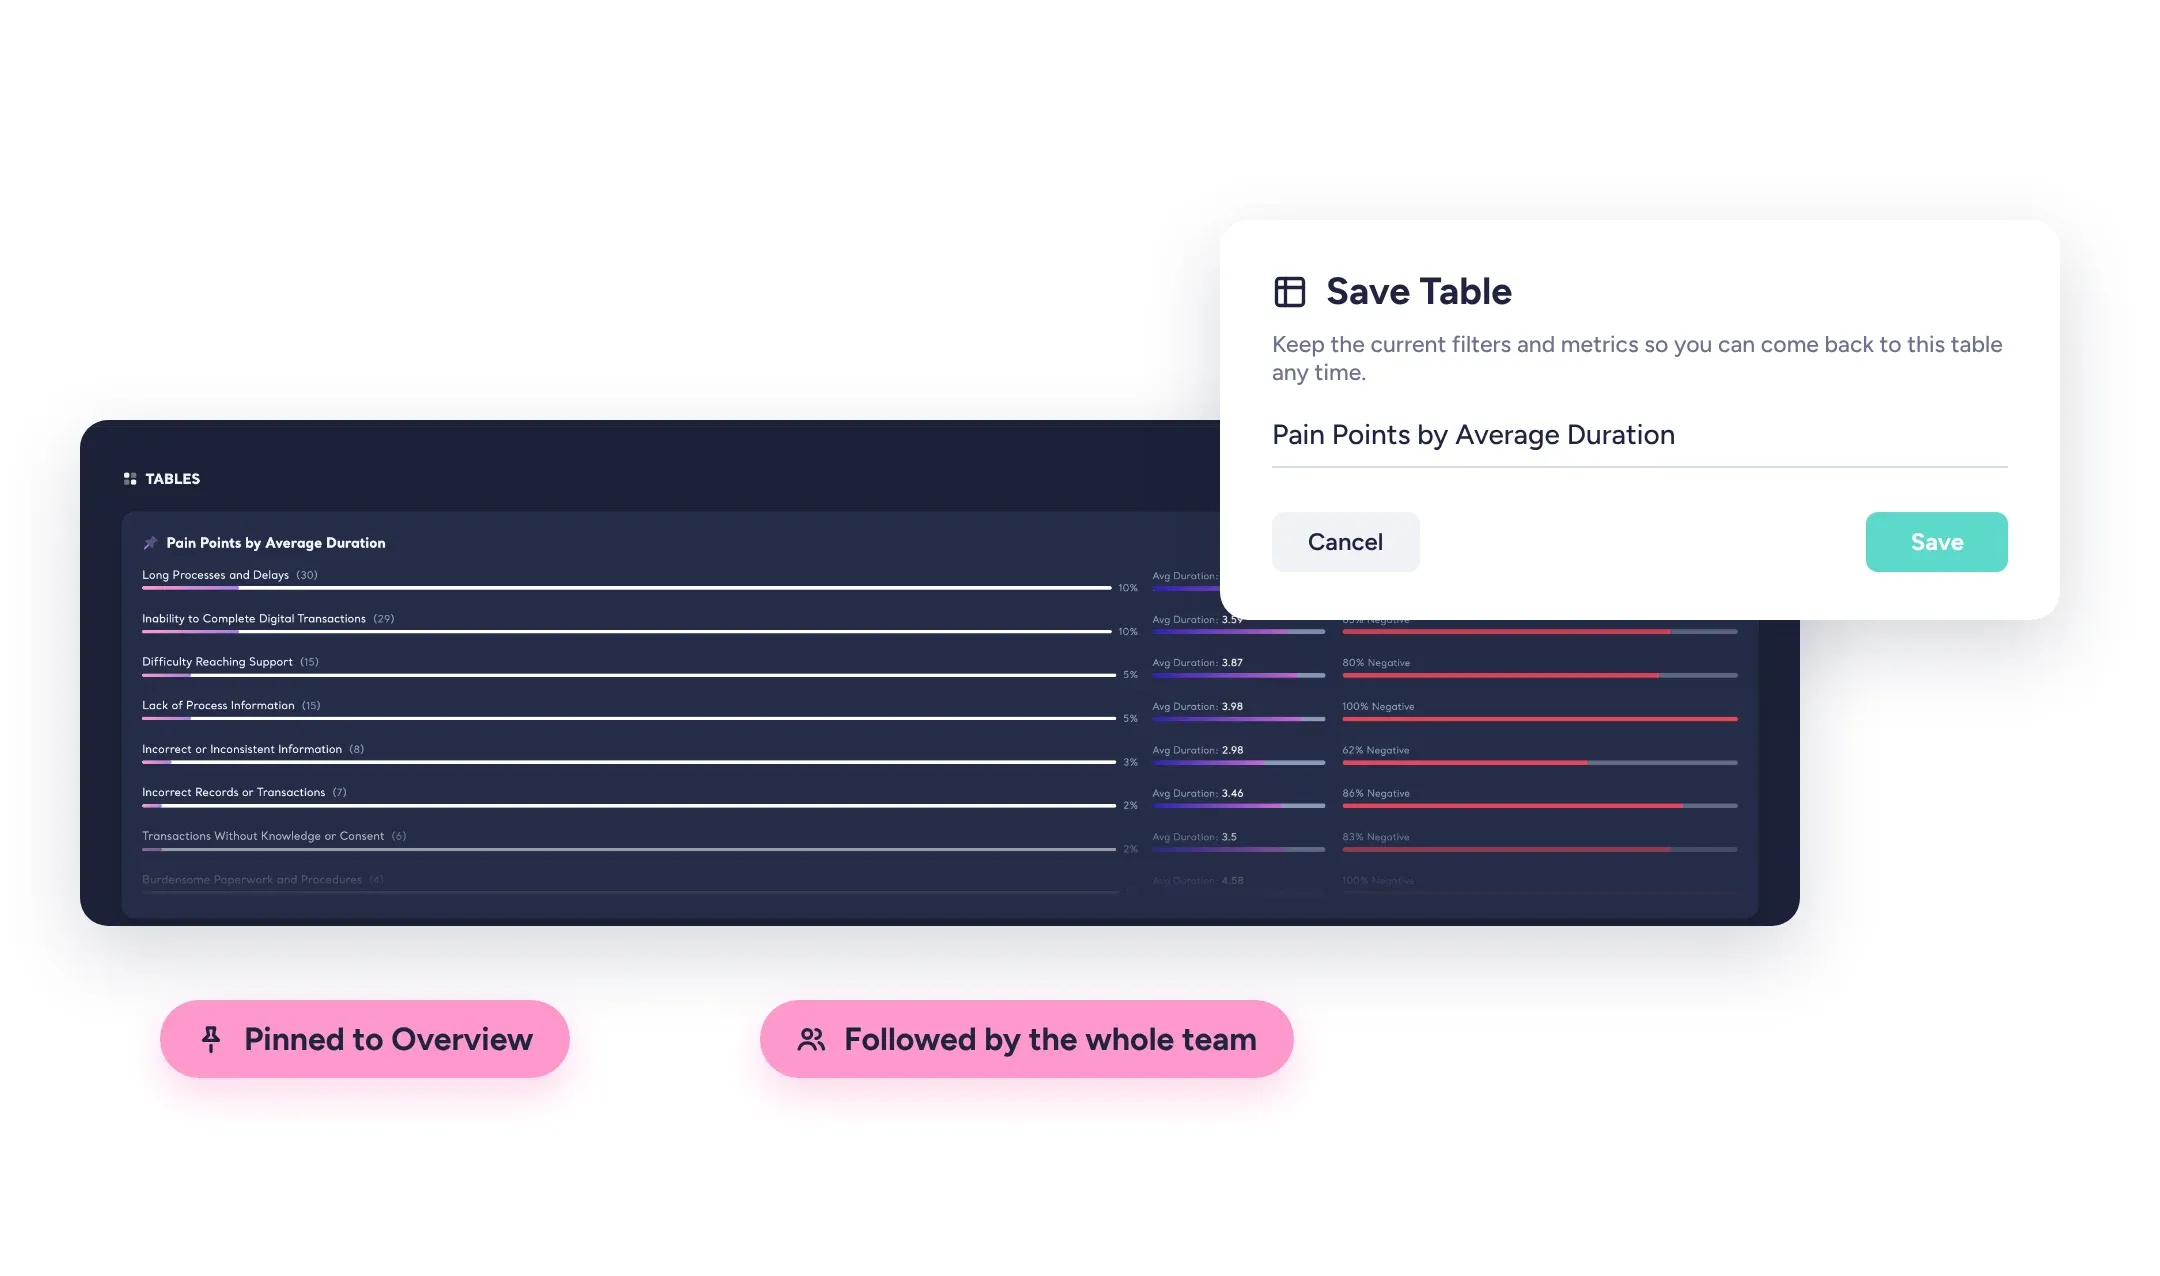
Upload call center transcripts with the length of each call, and you can see the average duration of calls from one city that share the same motivation. What customers say and how your operation performs finally sit in the same table, with no BI tool in between.
Tables the Whole Team Watches
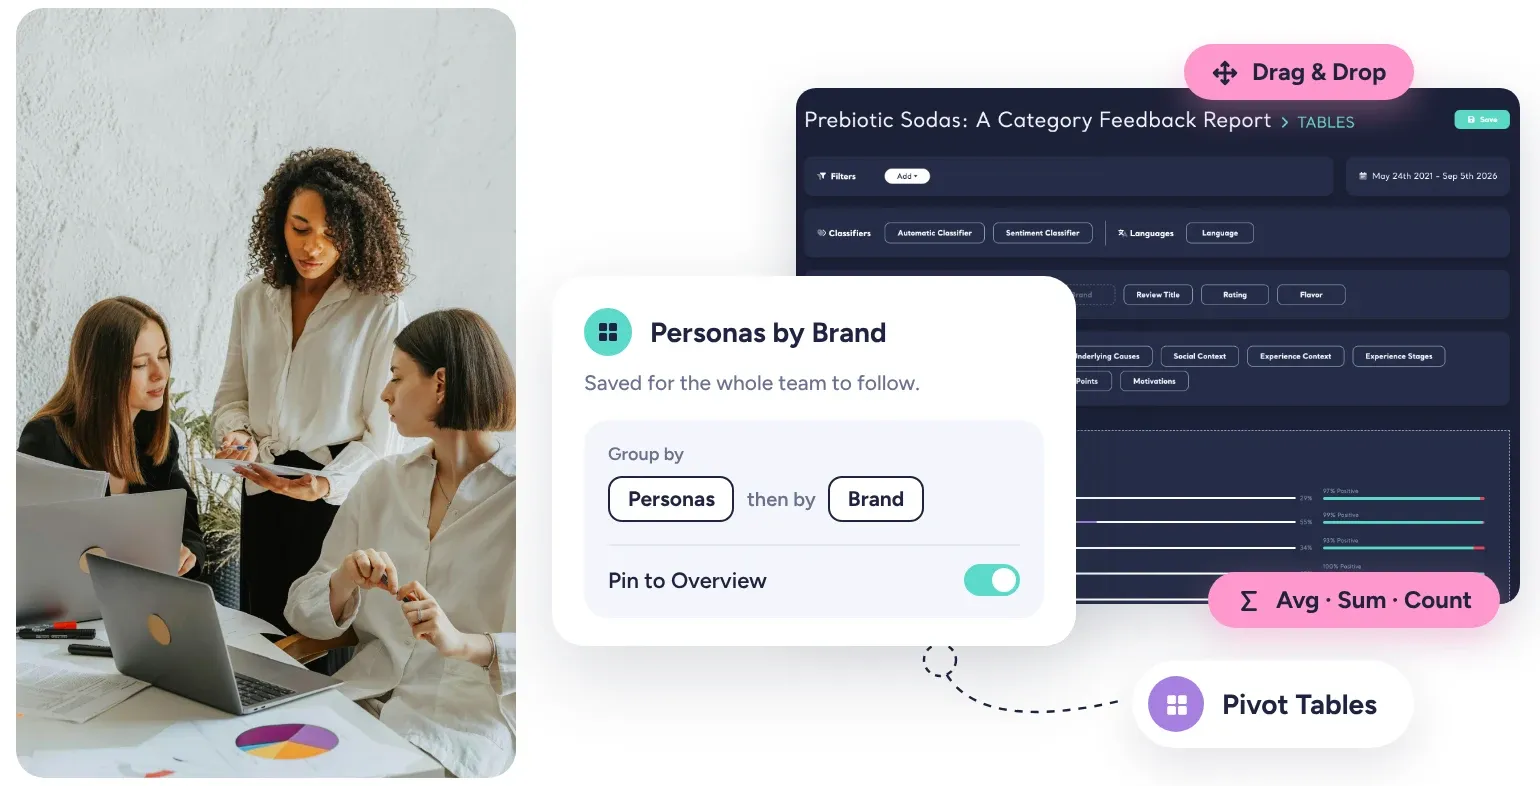
Build a table by dragging and dropping, then save it under a name your team will recognize. Pin it, and it appears on the Overview page the moment anyone opens the Report or Space, so the metrics you care about are followed by everyone instead of rebuilt by one person every month. In a Space, a saved table keeps growing as new files arrive.
In a Report, a table can also be copied or exported to PowerPoint. Tables in Spaces are part of the Enterprise package and Kimola On-Premises.
Related: Pivot Tables in Reports
Bring the feedback you already have.
Organize feedback like a research team.
See the people behind the feedback.
See how teams turn different kinds of feedback into research.






Frequently Asked Questions
About Pivot Tables
-
Why not just export the results to Excel?
You can, but Kimola's analysis is multi-label: one piece of feedback can carry several themes and several Dimension answers. Crossing that in a spreadsheet means splitting every record into many rows and keeping the counts right. Pivot Tables handle multi-label data for you and show every group with its records, its share and its sentiment, right where the analysis is.
-
Which fields can I cross with each other?
Any column of your data that isn't the feedback text itself, such as product, region, channel or customer type, together with Kimola's themes, sentiment, Dimension answers and the language of the feedback.
-
Can I see averages, like call duration or order value?
Yes. Kimola detects which columns hold numbers, so you can average, sum or count them for any combination, for example the average call duration of conversations about one pain point in one region.
-
Can my team see the tables I build?
Yes. Save a table under a name and your team can open it. Pin it, and it shows on the Overview page, so everyone sees the metrics you follow as soon as they open the Report or Space.
-
How do Pivot Tables relate to Signals?
They work from opposite directions. Signals test every combination for you and bring back the ones that stand apart. Pivot Tables let you ask a specific combination yourself. Teams often use both: a Signal points to a group, and a table explores it further.
-
How are Pivot Tables different from Compare?
Pivot Tables cross two fields and show every combination of their values. Compare puts up to five chosen segments side by side, such as products or regions, so you can see how they differ across the analysis.
Turn customer feedback into structured market research in 30+ languages—no AI training needed.
Create a Free Account No credit card · No commitment