Signals in Reports
min read - Created on Nov 03, 2026Signals is the page of a Report that lists the statistically tested findings in its feedback: the topics customers mention more often, or more negatively, in one group of feedback than in the others (Differences), and the topics whose mentions changed over time (Trends). Each finding is a card with the two numbers it compares, a short explanation, quotes in customers' own words and the evidence behind it. From a card you open its records in Tables and give it a verdict. Signals are available in every package.
To explore Signals, you need a Kimola account and a Report. If you don’t have an account yet, sign up first.
Sign in to your Kimola account and open the report you want to work with from the Reports section. If you haven’t created a report yet, follow one of these guides:
Kimola generates Signals after the Report’s analysis is complete.
You open the page from Signals in the menu of an open Report, or from See All Signals on the Signals card of the Report's Overview. The Overview card shows the number of signals in the Report and lets you step through them with Previous and Next. Each one shows how many times more, or less, the topic appears in its group than in the comparison, for example "3.05x". To learn what a Signal is and how Kimola tests it, see What is a Signal?
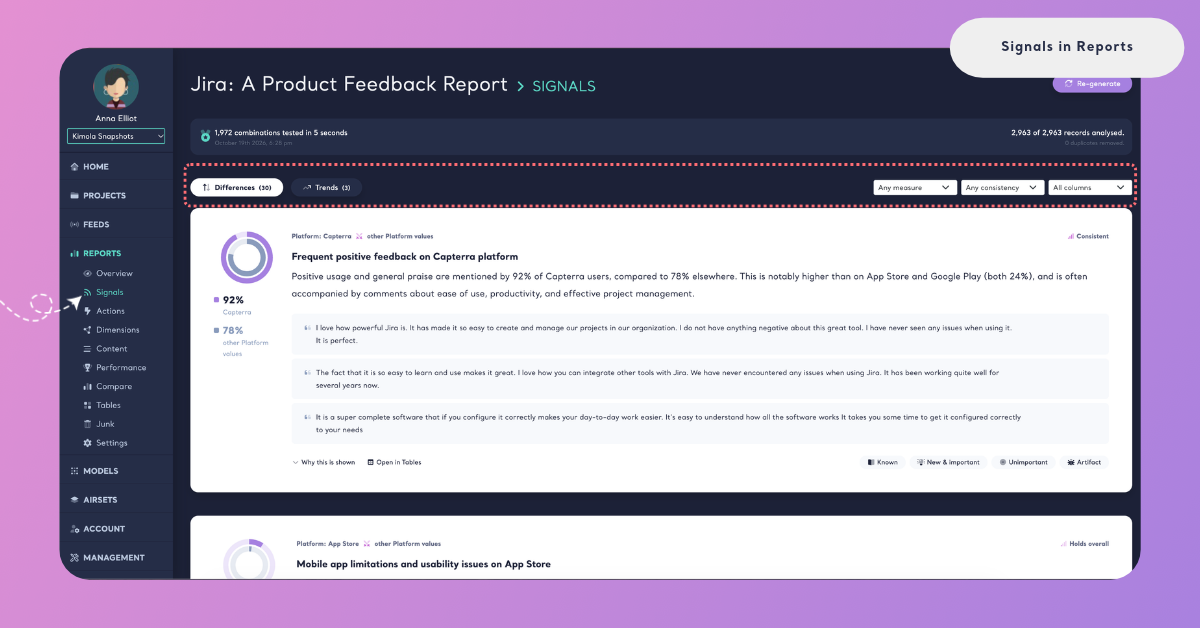
What You See
The page is read from top to bottom: a header that tells you what was tested, the two lists with their filters, and one card for each signal. Kimola generates a Report's signals after its analysis completes, so the page is ready when you open the Report.
The Header
The header says how much Kimola tested and on which records. The first line gives the number of combinations tested and how long the tests took, for example "1,972 combinations tested in 5 seconds", with the date and time the signals were generated under it. A combination is one topic crossed with one group, such as Late Deliveries in the reviews of the Android app. On the right, the header gives the number of records the tests read, for example "2,963 of 2,963 records analysed.", and how many duplicates were left out, for example "0 duplicates removed." Identical records are counted once, so a review pasted twice can't make a topic look larger than it is.
Re-generate in the top right corner generates the signals again; it is described under Re-generate Signals below.
The Filters
Below the header are the two tabs, Differences and Trends, each with the number of signals it holds, for example Differences (30) and Trends (3). Next to them, three filters narrow the open list:
Any measure shows every signal, or only the ones of one measure. Differences use Mentions and Negativity; Trends use Change. The menu offers the measures the open list contains.
Any consistency shows every signal, or only the ones with one consistency level: Consistent, Mostly consistent, Varies or Holds overall. The level tells how well a finding holds when Kimola splits the reviews into comparable groups.
All columns shows every signal, or only the ones whose group comes from one column of your dataset or one Dimension, such as a product column or Personas.
The filters only change what you see. They don't change the signals or their verdicts.
Signal Cards
Every signal is a card with the same parts. On the left, a ring and two large percentages give the measure in the group and in what it is compared with, each with its name, for example "92% Capterra" and "78% Other platforms". Above the title, a line names the column or Dimension, the group and the comparison, and on the right the card's consistency level.
The title sums up the finding in a few words. The text under it explains it in two or three sentences with its numbers, in the Report's output language. Up to three quotes follow, from the reviews behind the finding; click Show more >> to read a long one in full. If a card says "Writing the card...", Kimola is still writing its text. Its numbers are already computed, and the text appears when it is ready.
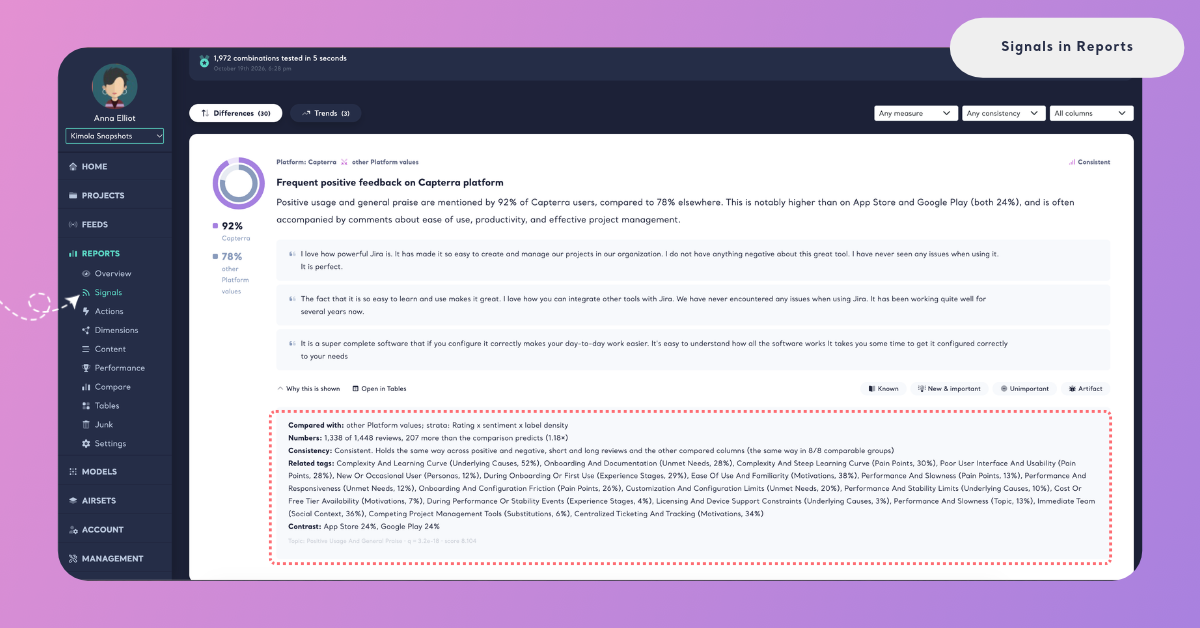
At the bottom of each card, click Why this is shown to explore the evidence behind the signal. This section includes:
- Compared with: The group used for comparison.
- Numbers: The record counts and comparison behind the finding, for example, “1,338 of 1,448 reviews, 207 more than the comparison predicts (1.18×)”.
- Consistency: How well the finding holds across comparable groups.
- Contrast and Related tags: Additional context shown for some findings.
For an explanation of each field, see What is a Signal?
Next to Why this is shown, click Open in Tables to explore the underlying records, or use Known, New & important, Unimportant or Artifact to record your assessment of the finding.
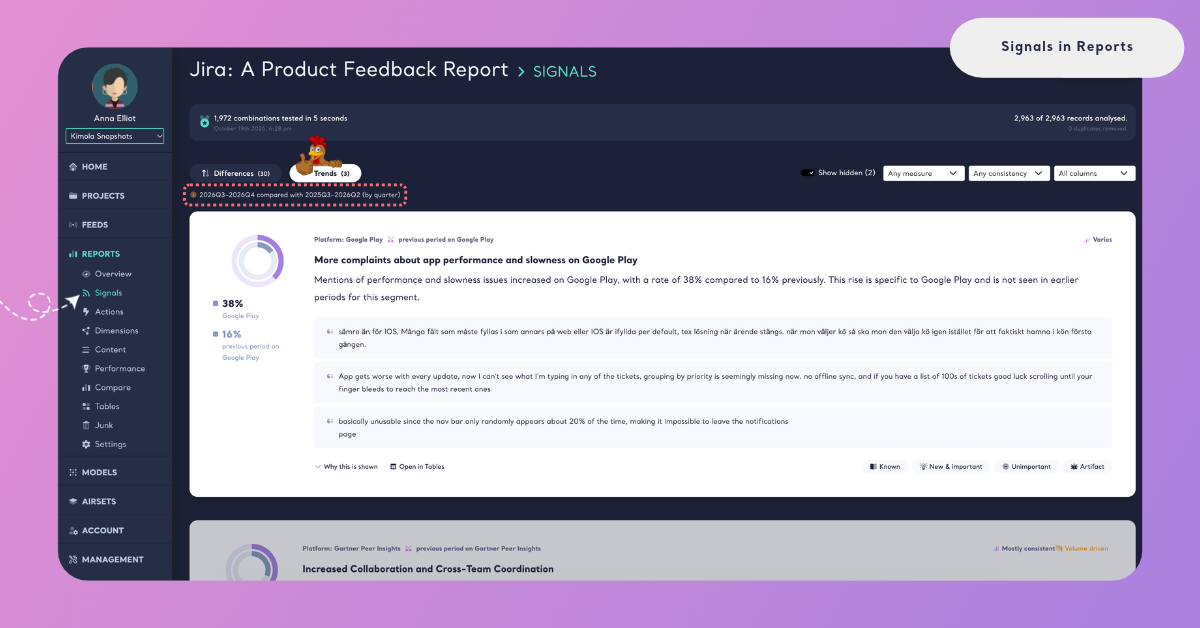
Differences and Trends
The two tabs hold the two kinds of signals. The page opens on Differences. When a Report has no Differences, it opens on Trends instead, so you never land on an empty list while the other one has signals.
Differences lists the topics that stand apart in one group of feedback. The group is a value of one of your columns, such as a platform, a product or a country, or an answer of a Dimension, such as one persona. A Difference can point up or down: a topic that one group rarely mentions is listed too. A Negativity Difference compares how negative the mentions are.
For a food delivery app, Late Deliveries is mentioned in 34% of the reviews written on the Android app and in 12% of the reviews on other platforms. Packaging may be mentioned as often in two cities, with 61% of its mentions negative in one and 24% in the others: a Negativity Difference.
Trends lists the topics whose mentions changed over time. Trends are built from the dates of your records, and a line above the list states the periods compared, for example "2026Q3–2026Q4 compared with 2025Q3–2026Q2 (by quarter)". On a Trend card, the two percentages are the topic's share in the latest periods and in the periods before. A Trend can cover all the feedback or one group of it, for example a rise in mentions of App Crashes only among the reviews of one app version.
Signals in both lists are ranked by how strong their evidence is. Kimola scores and ranks them with deterministic methods, so the same records always give the same signals in the same order. An AI model writes the titles and texts afterwards, from numbers that are already computed.
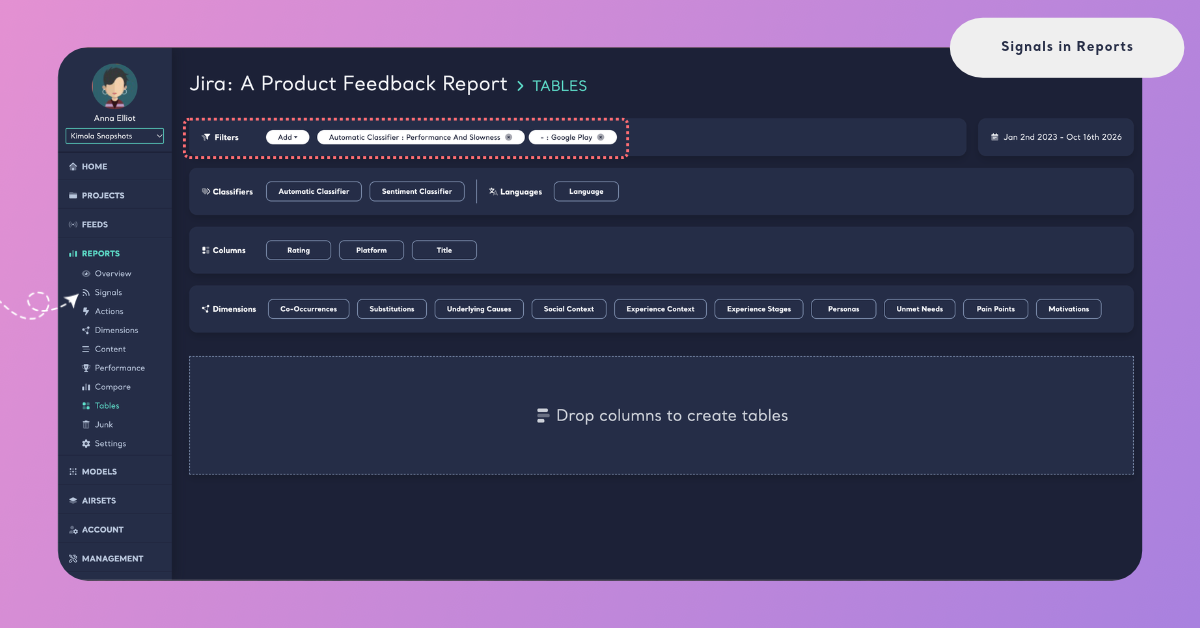
Open a Signal in Tables
A card is a summary. To read the feedback behind it, click Open in Tables at the bottom of the card. The Report's Tables page opens with the signal's filters already applied: the group the signal is about, such as the Android app, and the topic that was tested, such as Late Deliveries, where the signal has them.
From there you can read the records, cross them with other columns, classifiers and Dimensions, and save the table to come back to it.
To check a signal whose consistency is Varies or Holds overall, break its records down by your other columns and see where the finding comes from.
Review Signals
Each card takes a verdict from you, so your team can tell which findings it already knew and which ones need work.
- Known marks a finding your team already knew.
- New & important marks one that is new and needs attention.
- Unimportant marks one that holds but doesn't matter for your work.
- Artifact marks one that comes from how the data was collected or set up, not from customers.
Click the same verdict again to take it back. After a verdict, you can add a note in Add a note (optional) to say why.
Kimola also checks each card before it shows it. Cards marked Not supported by the verbatims or Volume driven are hidden unless you choose to show all signals, so the list starts with the findings that hold up. Filtering, verdicts, notes and showing all signals are described step by step in Review Signals.
Re-generate Signals
Re-generate generates a Report's signals again from its current records. Use it when the records of the Report have changed since the signals were generated, so the signals read the same records as the rest of the Report.
Re-generating permanently deletes the current signals and all the feedback given on them: the verdicts and the notes.
Before anything happens, Kimola asks you to confirm. Click Yes, re-generate to continue. Generating the signals again takes a minute or two. When it completes, the page says "The signals are generated again." and shows the new lists.
If the signals can't be generated, the page says "The signals could not be generated, please try again." or "The signals could not be generated for the current records." In the second case, the records give the tests too little to work with; see the next section.
When No Signals Appear
When no combination passes the tests, the page says "No signal has enough evidence in this report". A signal needs enough reviews in a group, and groups to compare, before a difference can be told apart from chance. More reviews, or more descriptive columns (for example product, brand, platform or country), give the tests more to work with. Trends also need records written across several periods.
To get signals for a Report that has none, create a new Report from a larger dataset, or from a file with more descriptive columns next to the text. Dimensions add groups too: every answer of a Dimension, such as each persona, can be compared with the others. See Add Dimensions to a Report.
Reports created before the current Signals page may show their signals in an earlier format, without the Differences and Trends tabs.
How It Differs in Spaces
Spaces are available in the Enterprise package. A Space has a Signals page with the same cards, tabs and verdicts, but its signals run again after every classified file, and the file itself is one of the groups, so a topic that stands apart in the latest file becomes a signal. A Space's card opens its records with Open in Content and offers Make a task, which turns the finding into a Task with its evidence. Reports don't make tasks. See Signals in Spaces.