Tables in Reports
min read - Updated on Nov 15, 2026Tables is the page of a Report where you cross-tab its feedback: you drag classifiers, columns and Dimensions into a table, and Kimola groups every record by them and shows how many records fall into each group, what share of the feedback that is and how positive or negative each group is. Use it to answer questions such as "Which pain points come up on each platform?" or "How does sentiment differ between languages?" without leaving Kimola or exporting the data.
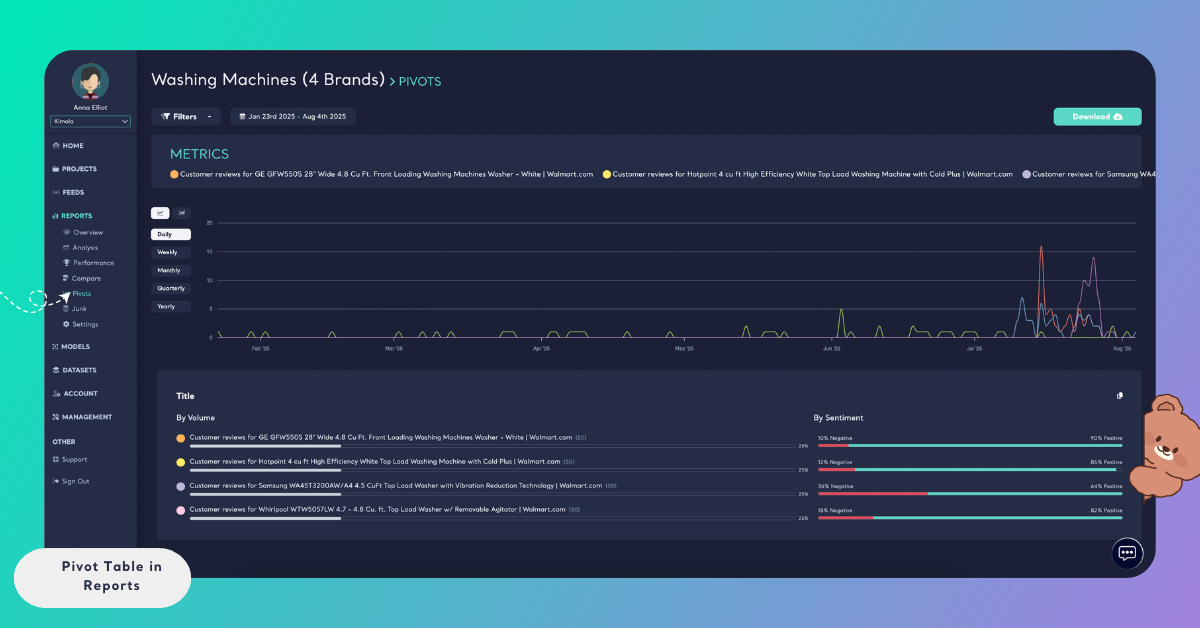
You open Tables from Tables in the menu of an open Report. The page works on the data the Report has already analyzed, so building a table never starts a new analysis and never changes the Report.
[Screenshot: The Tables page of a Report with a table grouped by two metrics]
What Tables Are For
Reading records one by one tells you what customers say. A table tells you how much of it there is and where it comes from. Use Tables when you want to compare groups of feedback with the same measures: the themes of each product, the pain points of each platform, the sentiment of each language or of each rating. A table turns a large dataset into a short, structured view that you can read at a glance, and it keeps the link to the data, because every table can be narrowed with the same filters you use on the other pages of the Report.
A Report holds the App Store and Google Play reviews of a ride-hailing app. Group the table by the Platform column, then by Pain Points, and each platform shows its pain points with their shares, for example driver cancellations and surge pricing. If app crashes is large on one platform only, you know where to look first.
What You See
The page opens with the name of the Report. From top to bottom, it shows the parts below.
Filters. The filters in use and the Add menu that adds one. With none, the card shows only Add. The dates of the Report's records appear in a card on the right, and clicking them lets you choose a period.
Classifiers. One button for each classifier of the Report, such as the content classifier that holds its themes and the Sentiment Classifier. When the Report's feedback is in more than one language, Language appears next to them under Languages.
Columns. One button for each column of your data, such as a rating, a platform or a title.
Dimensions. One button for each Dimension of the Report.
The table area. Until you add a metric, it says Drop columns to create tables. Once a table exists, a Save button appears at the top right of the page.
[Screenshot: The Tables page before any metric is added, with the Filters card, the Classifiers, Columns and Dimensions cards, and the empty table area]
Build a Table
A table is built from metrics. A metric is a classifier, a column, a Dimension or the language of the feedback, and the table groups the records by its values: by the labels of a classifier, by the values of a column or by the answers of a Dimension. To add a metric, drag its button into the table area. The table appears at once, with one row for every group.
The metric you add shows as a chip at the top of the table, and its button above is dimmed while it is in use. Click the cross on a chip to remove the metric. To look at the same records from another angle, drag a second metric into the table. Its groups then appear under each group of the first metric, so that you can read, for example, the ratings inside every language.
[Screenshot: A table grouped by Language, then by Rating, with the two metric chips above it]
Every row shows the name of its group, the number of records in brackets and a bar with its share. A row of the first metric shows its share of all the records the table reads. A row under it shows its share of the group above it: if a group has 100 records and 51 of them have a 5-star rating, the 5-star row under it shows 51%. The bar on the right shows the sentiment of the group: green for positive feedback, red for negative feedback and grey for feedback that is neither. The label above it gives the share of positive feedback, such as "81% Positive", or the share of negative feedback, such as "100% Negative", when the group has no positive feedback at all.
The order of the metrics decides how the table reads. A table grouped by Platform, then by Pain Points, shows the pain points of each platform. A table grouped by Pain Points, then by Platform, shows how each pain point splits across platforms.
Because a piece of feedback can carry several labels, in a multi-label Report the shares of a metric can add up to more than 100%.
Group by Language
When the feedback of a Report is in more than one language, Language is offered next to the classifiers, under Languages. Drag it into the table to group the feedback by language: each group shows the language, its number of records, its share and its sentiment. Language works like any other metric, so you can group by Language and then by the content classifier to see whether customers who write in one language talk about other themes than the rest. When all the feedback of a Report is in one language, Language is not shown. Language options for creating a Report are described in Language Options in Reports.
[Screenshot: A table grouped by Language, with each language's record count, share and sentiment bar]
Measure a Number Column
A column that holds numbers, such as an order amount, a price or a score, can be measured instead of used for grouping. A measured column does not split the records into groups. Kimola calculates it from its values and shows the result for every group of the table and for all the records together. The measures are Average, Sum, Minimum, Maximum and Median. Choose between measuring the column and grouping the records by its values with the control on the metric, which says "Measure this column or group the records by its values", and pick Group by values to use the column as a group again.
A Report holds the support survey answers of an online electronics store, with a column for the minutes a customer waited. Group the table by the content classifier and measure the waiting time with Average. Each theme then shows the average wait of its records, and the average of all records is shown beside them.
Only columns whose values are numbers can be measured. A column of text, such as a title or a platform, always groups the records by its values.
Filter a Table
Filters narrow the records a table reads, and the table is built again from those records only. Click Add in the Filters card to choose what to filter by: Classifications for the labels of a classifier, Columns for the values of a column, and Languages for the languages of the feedback. Pick the values you want and click Apply. To read a period, click the dates at the top right of the page and choose one. Each filter shows in the Filters card as a chip, and you remove it by clicking its cross. Filters change what the table reads and never the data of the Report.
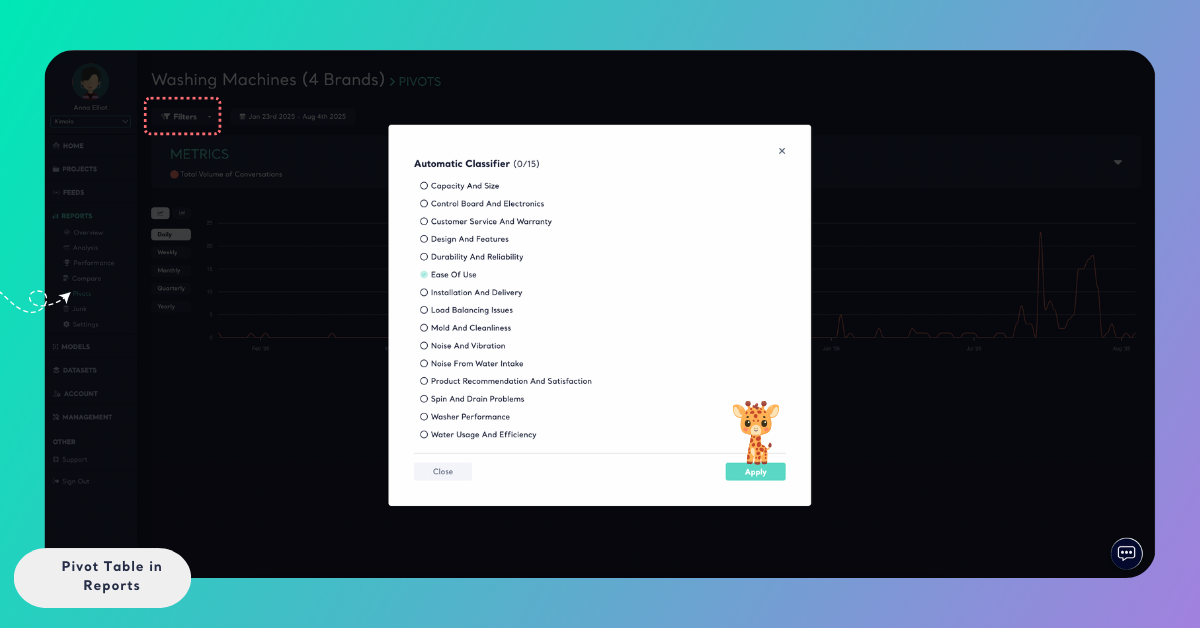
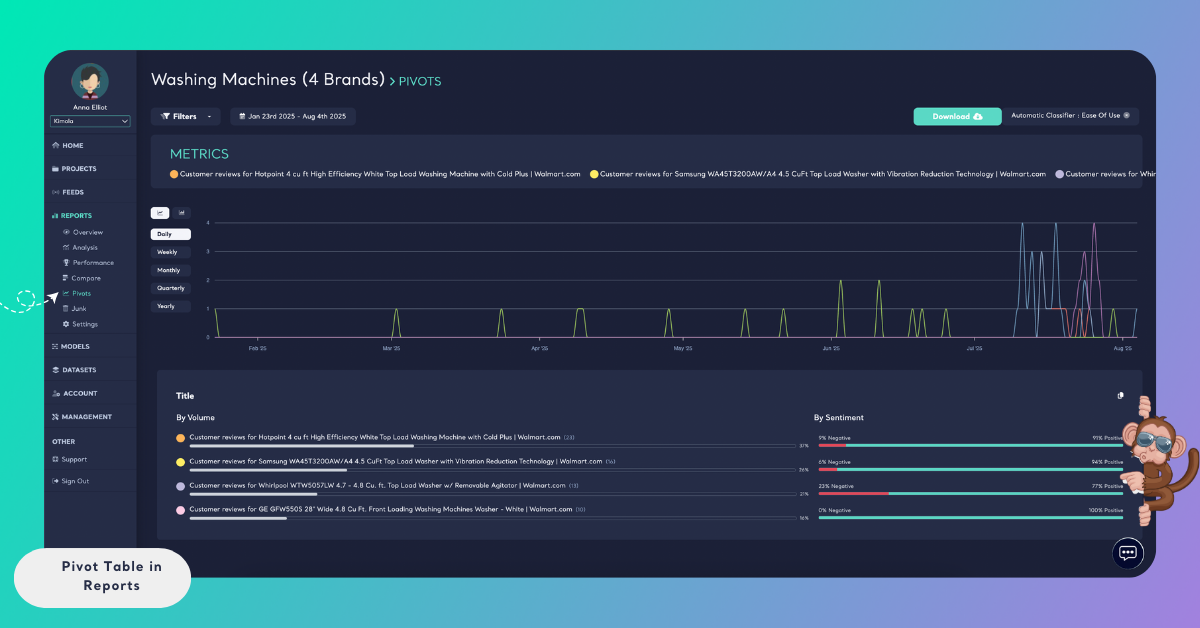
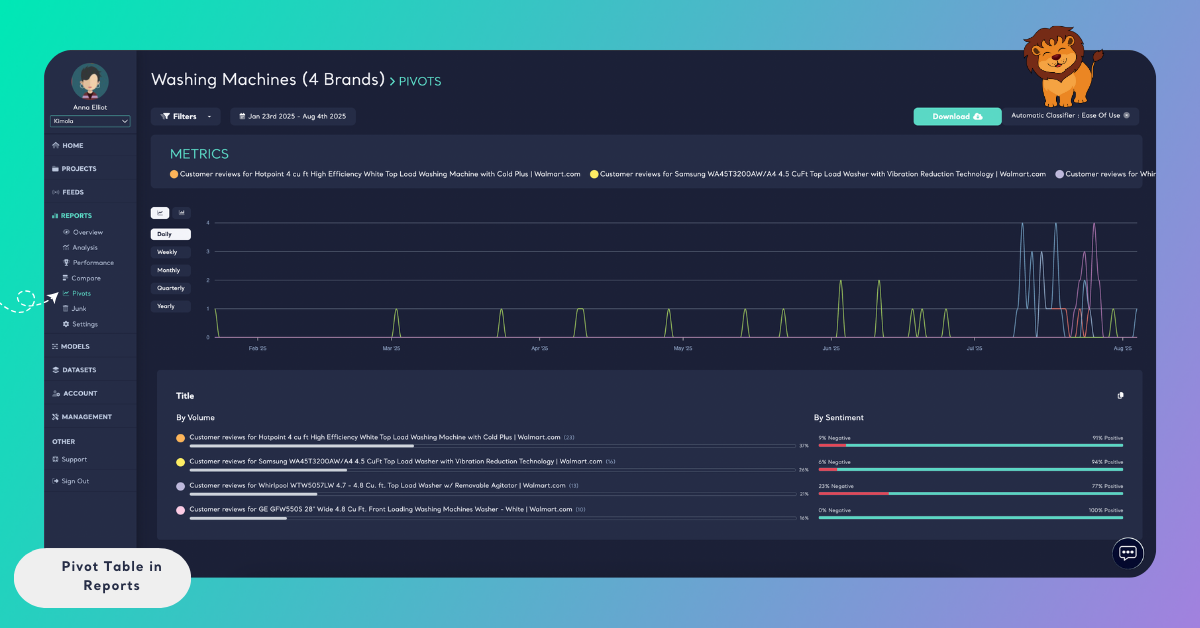
Filters and metrics work together. Filter the records to one theme, then group the table by a column, and the table shows how that theme is spread across the values of the column.
For a Report of project management software reviews, filter by the theme Ease of Use, then group the table by the Title or Platform column to see how the same theme performs for each one.
Save, Rename and Delete Tables
A table you build is a view that disappears when you leave the page, unless you save it. Click Save at the top right, or the button that says "Save the current filters and metrics as a table", to open the Save Table window. It keeps the current filters and metrics so that you can come back to the table at any time. Type a name in the field for a friendly name and click Save. The window can't be saved without a name, and Cancel closes it without saving.
Saved tables are listed under Choose a Table, where you reopen one. Opening a saved table puts its filters and metrics back. Change the filters or the metrics of an open table and Update this table with the current filters and metrics keeps the change, while Save as new table keeps the changed table as another one and leaves the first as it was. Rename this table opens the Rename Table window, and Delete this table removes the saved table. Rename and delete are in the table's menu. Deleting a saved table removes only the saved filters and metrics. The Report and its records stay as they are.
Choose a name that says what the table shows, such as "Pain Points by Platform", so that the right table is easy to find in Choose a Table.
Pin a Table to the Overview
A saved table can be pinned to the Overview of the Report, so that the cross-tabs you check most often are on its first page. The TABLES card of Overview in Reports shows the pinned tables, each with an Open Table link that opens it here. A Report with no pinned table shows Create Tables in the card, which takes you to Tables, and a Report with pinned tables shows Configure.
[Screenshot: The TABLES card on the Overview of a Report with a pinned table and its Open Table link]
Open a Signal in Tables
Tables is also where you check a finding. A Signal says that a topic is mentioned more, or more negatively, in one group than in the others. Click Open in Tables on a Signal's card on Signals, and Tables opens with the filters of the Signal already applied, so you can see where the difference comes from.
How It Differs in Spaces
A Space has a Tables page too, built the same way from its classifiers, columns and Dimensions. The Space's table reads every classified file, so it grows as new files join, and you can make a task from it. A Report's Tables page can save tables under a name, pin them to the Overview and measure number columns, and a Space's page keeps a table by its link instead. See Tables in Spaces for the Space's page. To compare groups of records side by side with sentiment counts and NPS, use Compare in Reports.