Tables in Spaces
min read - Updated on Nov 10, 2026Tables is the page of a Space where you cross-tab its feedback: you pick one or two metrics (a classifier, a column, a Dimension or the language of the feedback), and Kimola groups every record by them and shows how many records fall into each group, what share of the feedback that is and how positive or negative each group is. Use it to answer questions such as "Which pain points come up in each product line?" or "How does sentiment differ between our regions?".
Spaces are available in the Enterprise package and in Kimola On-Premises. To build a table, sign in to Kimola and open a Space with at least one classified file. Make sure the metric you want to group by is available in that Space. For example, to group feedback by Pain Points, the Space’s Funnel must include a Pain Points model.
If you don’t have a Space yet, see Create a Space. If you haven’t uploaded your first file, see Add Files to a Space. To set up a Dimension in your Funnel, see Add Dimensions to a Funnel.
You open Tables from Tables in the menu of an open Space. The page reads every classified file of the Space, so a table grows as new files join.
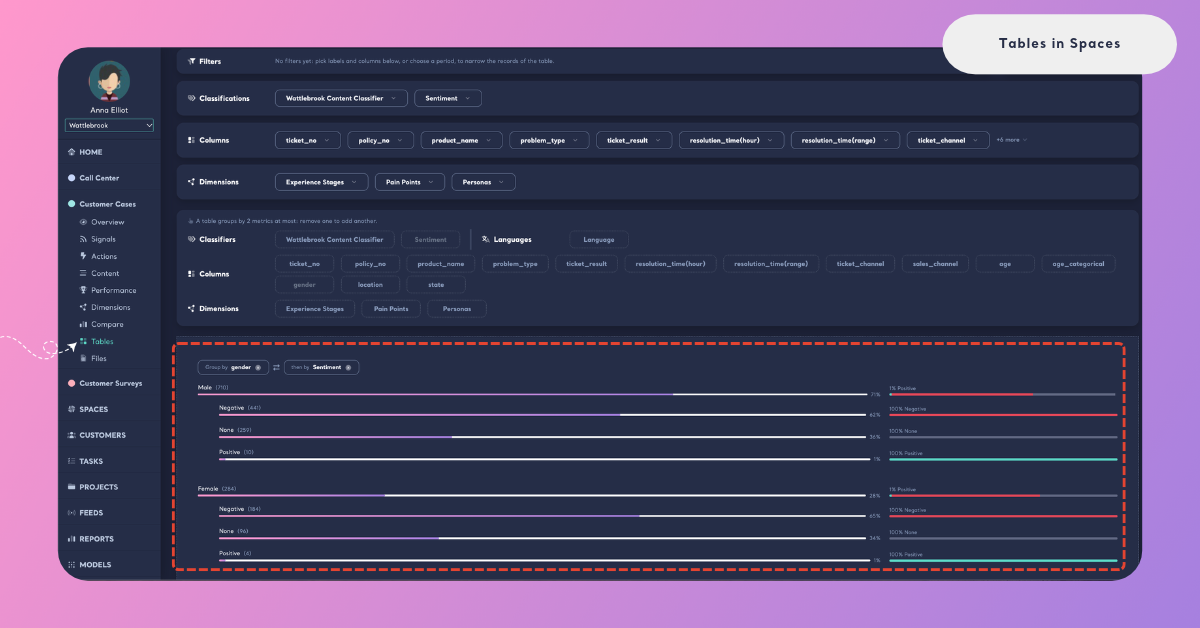
What You See
The page opens with the name of the Space and a line that tells what it holds, for example "999 records covering November 4th 2024 to March 1st 2025", with the date and time of the last upload next to it. Only classified records are counted: a file shows on Tables once its classification is completed. See Add Files to a Space.
Below that line, the page is read from top to bottom in this order.
- Filters and the period. The filters in use, each as a chip you can remove, and the dates of the records on the right. With no filter, the card says "No filters yet: pick labels and columns below, or choose a period, to narrow the records of the table."
- Classifications, Columns and Dimensions. One button for each classifier of the Space's Funnel, each column of its files and each Dimension. Pick values from them to build the table from those records only.
- The metrics. Every metric you can group by, under Classifiers, Languages (when the feedback is in more than one language), Columns and Dimensions, with the hint "Drag a metric into the table below, or click it."
- The table. The area where the table is built. Until you add a metric, it says Drop metrics to create a table.
- Make a task. The button at the top right of the page, which turns the records the table reads into a task.
Build a Table
A table groups the Space's records by up to 2 metrics. Each metric is one of these:
- A classifier. The content classifier groups records by its labels (for example "Late Delivery" or "Refund Request"), and the sentiment classifier by Positive, Negative and None.
- A column. Any column of the Space's files that is not a text field, such as a product, a region or a channel. The records are grouped by the values of the column.
- A Dimension. One of the Funnel's Dimensions, such as Pain Points or Personas. The records are grouped by the answers they give.
- Language. The language of the feedback, offered only when the Space's texts are in more than one language. See the section below.
To add a metric, drag it into the table area or click it. The first metric becomes Group by, the second then by, and the table shows every group of the first metric with the groups of the second metric under it. A metric in use is dimmed in the list. When the table already has 2 metrics, the page says "A table groups by 2 metrics at most: remove one to add another."; click the cross on a metric's chip to remove it.
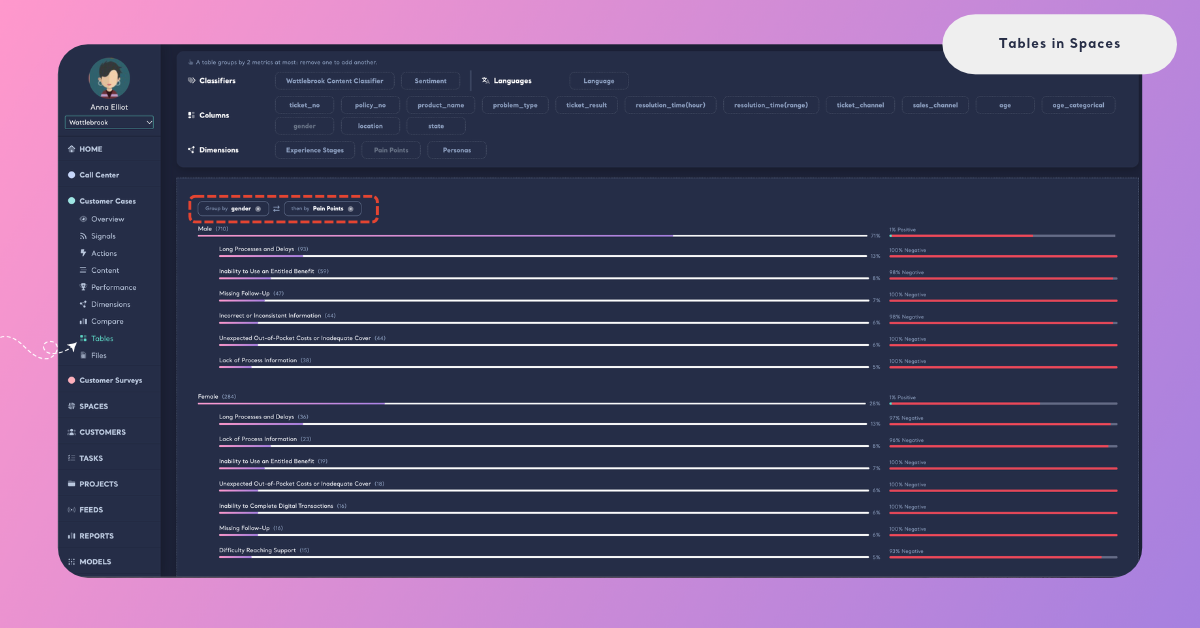
Every row of the table shows the name of the group, its number of records in brackets and a bar with its share. A row of the first metric shows its share of all the records the table reads. A row under it shows its share of the group above it.
Because a piece of feedback can carry several labels or Dimension answers, the shares of a metric can add up to more than 100%.
The bar on the right of every row shows the sentiment of the group: green for positive, red for negative and grey for feedback that is neither. The label above the bar gives the share of positive feedback, or the share of negative feedback when the group has no positive feedback at all.
The metrics are kept in the page address, so a copied link opens the same table for a teammate. A Space doesn't save tables under a name; to come back to a table, keep its link.
Narrow the Records of a Table
Every filter on the page changes the table. Pick a label from Classifications, a value from Columns or an answer from Dimensions, or click the dates to choose a period, and the table is built again from those records only. Each filter shows as a chip in the Filters card; click the cross on a chip to remove it, or Reset all to remove every filter. See Filter Records in Spaces.
Filters and metrics work together.
For a retail chain, filter the table to the last month and group it by a Region column, then by Pain Points, to see which problems each region reported most in that month. Then change the period to the month before and compare.
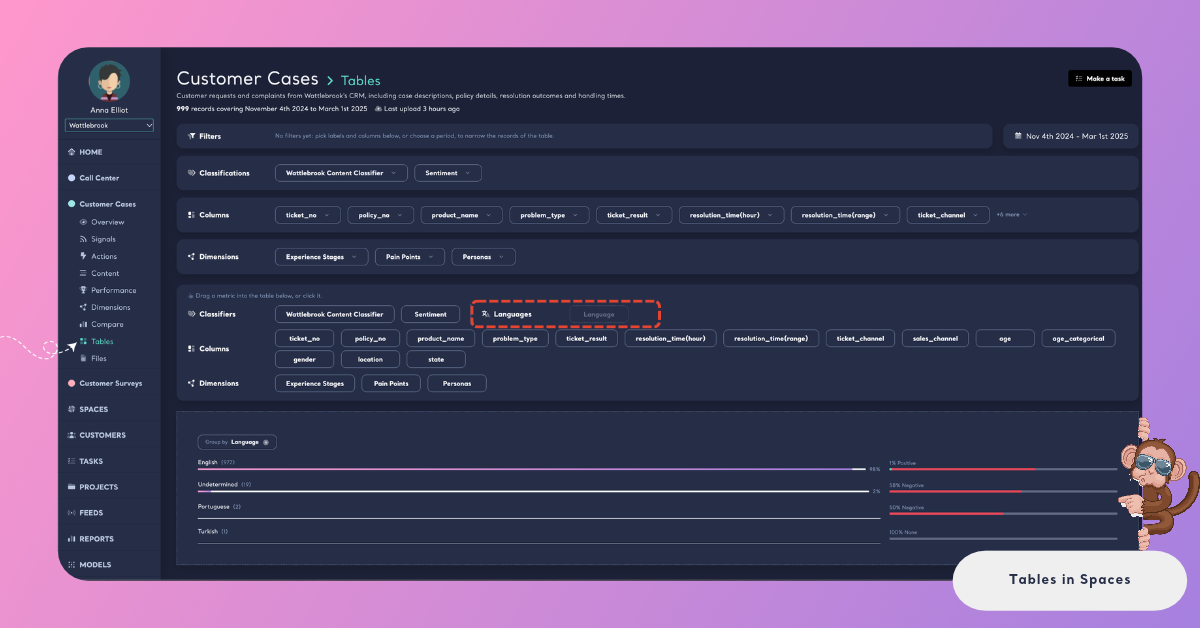
Group by Language
When the texts of a Space are in more than one language, Language is offered under Languages, next to the classifiers. Drag it into the table, or click it, to group the feedback by language: every group shows the language, its number of records, its share and its sentiment. In a Space, the language is read for each text field of a record, not once for the whole record. Feedback whose language can't be told shows under Undetermined.
Language works like any other metric. Group by Language, then by the content classifier, to see whether customers who write in one language talk about other themes than the rest. When all the feedback of a Space is in one language, Language is not shown.
Change the Order of Metrics
The order of the 2 metrics decides how the table reads. Click the arrows between the Group by and then by chips (Swap the order of the metrics) to turn the table around.
A table grouped by Sentiment, then by Pain Points, answers "What do negative records complain about?": under Negative you see the pain points of the negative feedback and each one's share of it. Swap the metrics, and the same table answers "How negative is each pain point?": every pain point is a group of its own, with its records split into Positive, Negative and None under it.
Make a Task from a Table
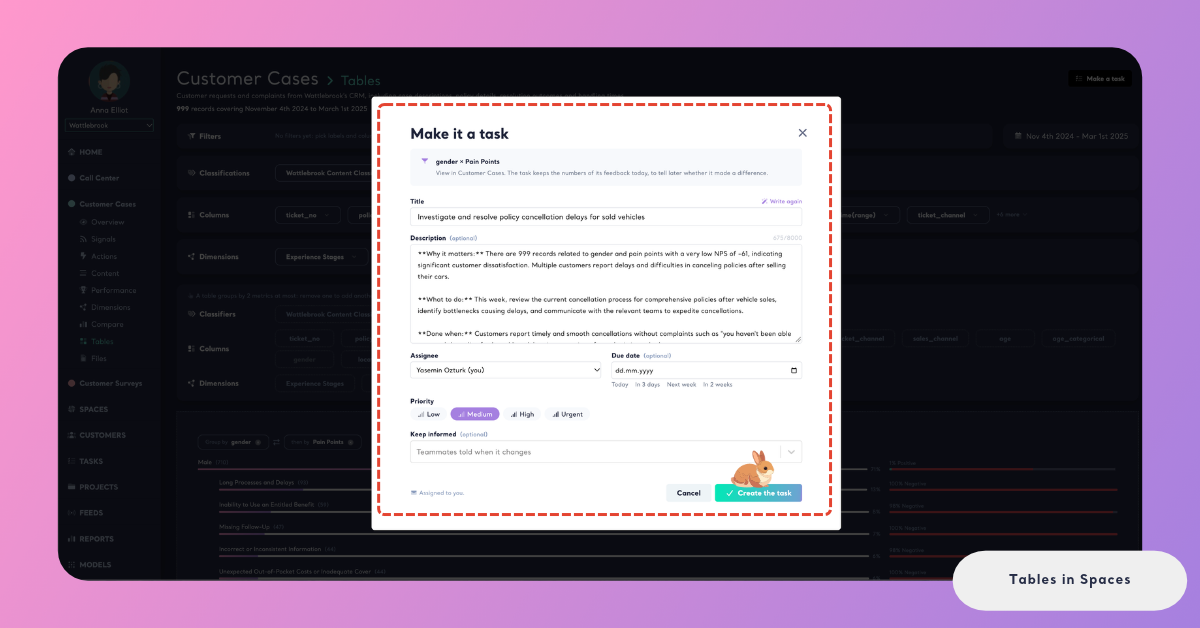
When a table shows something your team should act on, click Make a task at the top right of the page (Make a task of the records this table reads). The Make it a task window opens with the metrics of the table as its finding (for example "Pain Points × Region"), and the note that the task keeps the numbers of its feedback today, so Kimola can tell later whether it made a difference. The task covers all the records the table reads, with its filters and period, not one row of it.
To make a task of one group, filter the page to that group first.
Kimola drafts the title and the description in the Funnel's language. Choose the assignee, the due date, the priority and the teammates to keep informed, then click Create the task. On the task, its source is shown as View. See Create a Task and What is a Task?.
How It Differs from Reports
A Report has a Tables page too, built the same way from its classifiers, columns and Dimensions. In a Space, the table reads every classified file, so it grows as new files join, and you can make a task from it. A Report can save a table under a name, pin it to its Overview and measure a number column (Average, Sum, Minimum, Maximum, Median); in a Space, a column always groups the records by its values, and a table is kept by its link. See Tables in Reports for the Report's page.
If the page says "The table could not be loaded, please try again.", reload the page.