Performance in Spaces
min read - Updated on Nov 10, 2026Performance is the page of a Space that ranks its themes by how satisfied and how dissatisfied customers are with them. Every theme gets a Satisfaction Score and a Dissatisfaction Score from 0 to 100: its share of positive or negative feedback, statistically adjusted so that a theme with a handful of records and a theme with hundreds can be compared fairly. The page shows the five best performing themes by Satisfaction Score and the five worst performing themes by Dissatisfaction Score, for all the records of the Space or for the records your filters leave.
You open Performance from Performance in the menu of an open Space. The page reads every classified file of the Space, so its ranking changes as new files join.
Spaces are available in the Enterprise package and in Kimola On-Premises. To see scores on Performance, sign in to Kimola and open a Space whose Funnel includes both a content classifier and a sentiment classifier. The Space must also have at least one classified file.
If you’re setting up your first Space, see Create a Funnel and Create a Space. To upload your first file, see Add Files to a Space.
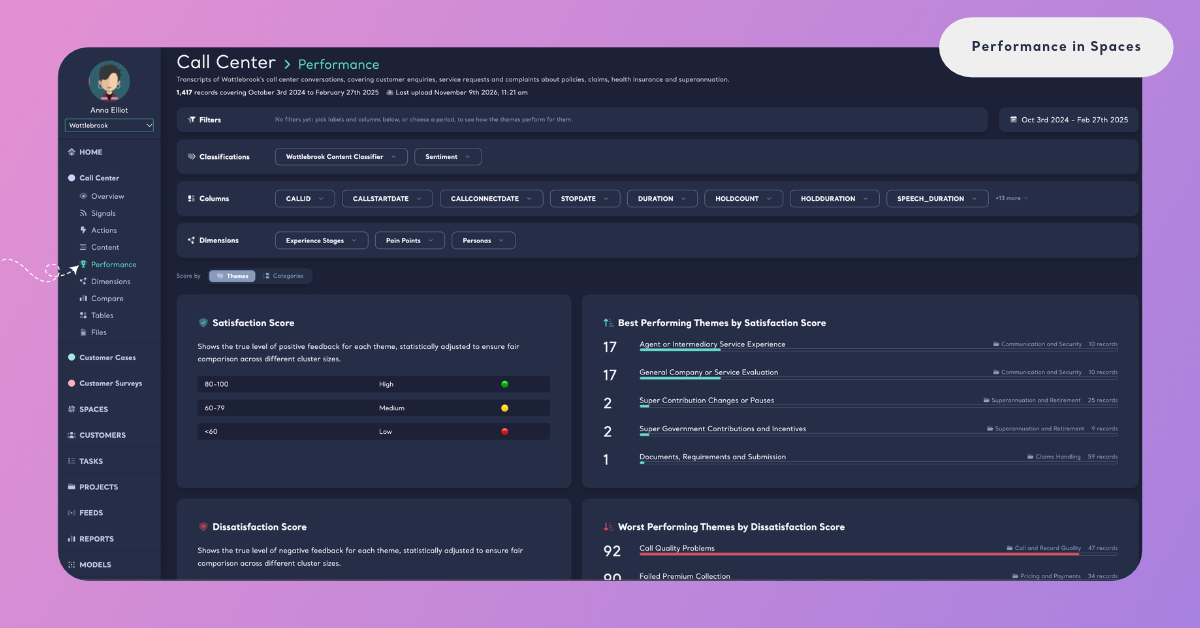
What You See
The page opens with the name of the Space and a line that tells what it holds, for example "1,417 records covering October 3rd 2024 to February 27th 2025", with the date and time of the last upload next to it. Only classified records are counted: a file shows on Performance once its classification is completed. See Add Files to a Space.
Below that line, the page is read from top to bottom in this order:
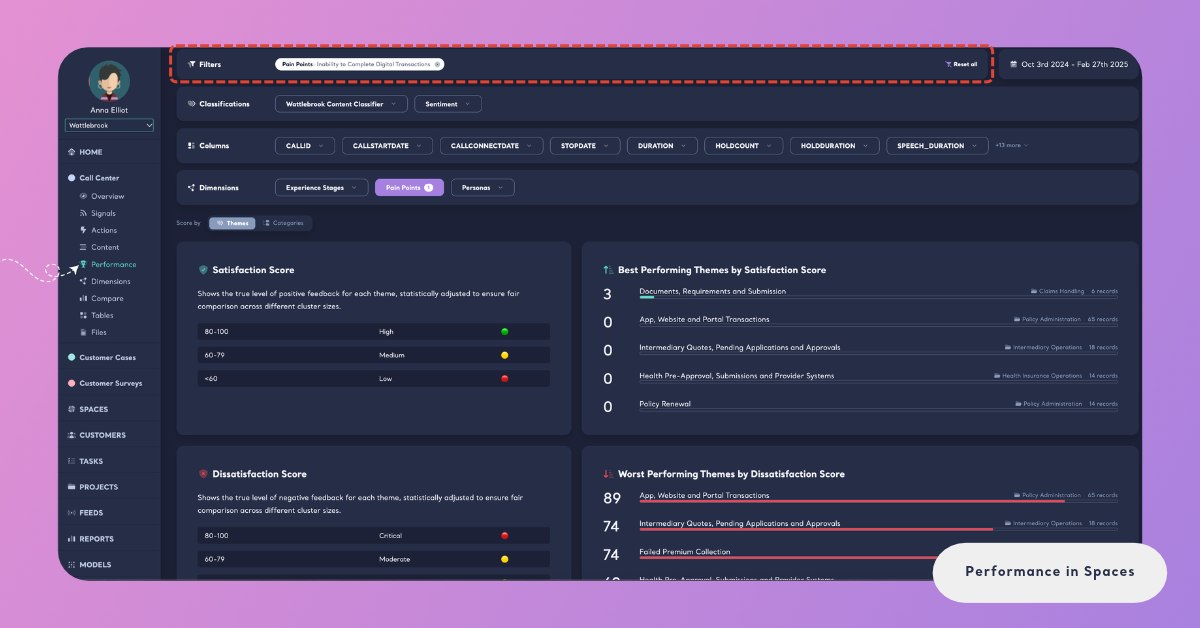
- Filters and the period: The filters in use, each as a chip you can remove, and the dates of the records on the right.
- Classifications, Columns and Dimensions: One button for each classifier of the Space's Funnel, each column of its files and each Dimension. Pick values from them to score the themes for those records only.
- Score by: The choice between scoring single themes (Themes) and whole categories (Categories).
- Satisfaction Score: What the score means and its three ranges, next to Best Performing Themes by Satisfaction Score.
- Dissatisfaction Score: What the score means and its three ranges, next to Worst Performing Themes by Dissatisfaction Score.
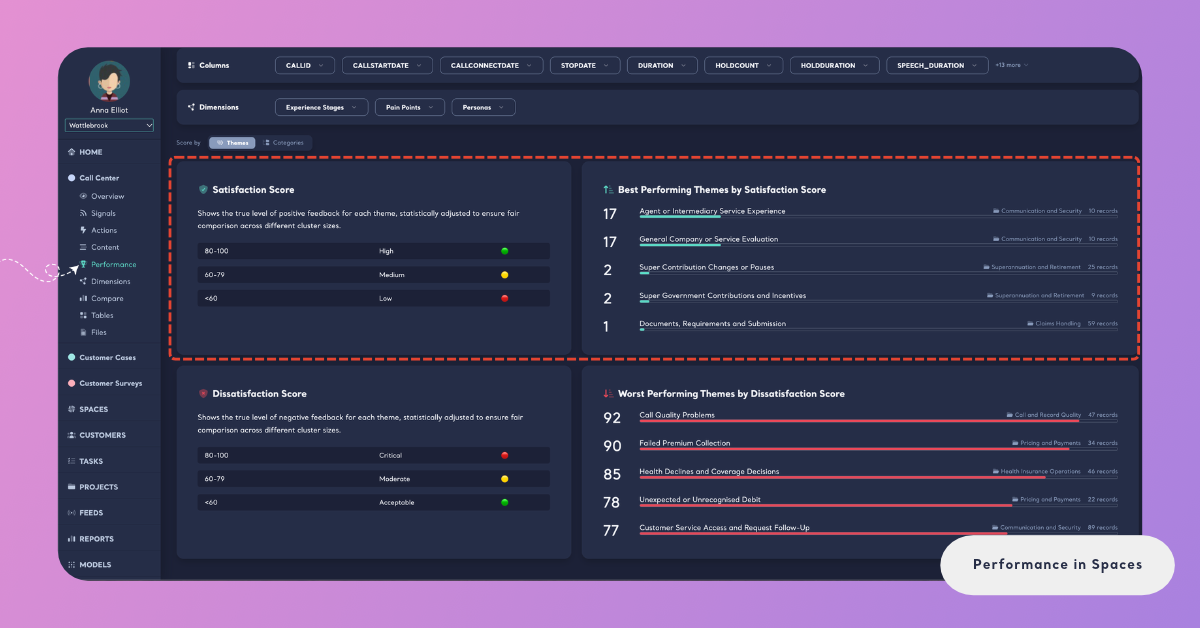
Satisfaction Score
The Satisfaction Score "shows the true level of positive feedback for each theme, statistically adjusted to ensure fair comparison across different cluster sizes." The card on the left explains how to read it:
- 80-100: High: Customers speak positively about the theme in most of its feedback, and there is enough feedback to trust it.
- 60-79: Medium: Positive feedback is common, but the theme also draws complaints, or it has too few records to score higher.
- <60: Low: The theme is not a source of satisfaction yet.
Next to the card, Best Performing Themes by Satisfaction Score lists the five themes with the highest score, highest first. Each row shows the score, the name of the theme, the category it belongs to and its number of records, with a bar for the score. Point to a theme to read its full name when it is cut short.
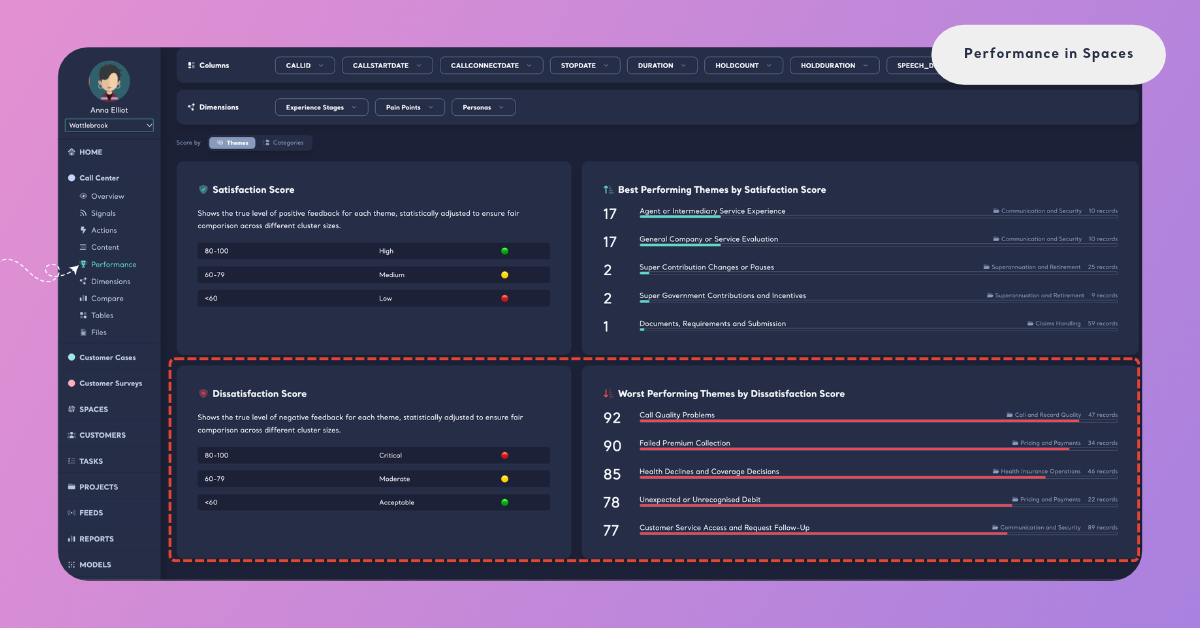
Dissatisfaction Score
The Dissatisfaction Score "shows the true level of negative feedback for each theme, statistically adjusted to ensure fair comparison across different cluster sizes." Its ranges read the other way around, because a high score is bad news:
- 80-100: Critical. Most of the theme's feedback is negative, across enough records to be sure of it.
- 60-79: Moderate. The theme draws a lot of negative feedback and is worth watching.
- <60: Acceptable. Negative feedback on the theme is limited.
Worst Performing Themes by Dissatisfaction Score lists the five themes with the highest Dissatisfaction Score, highest first, with the same score, category, record count and bar on every row. These are the themes that cost you the most customer satisfaction, and the first place to look when you decide what to fix.
Why the Scores Are Adjusted
A plain percentage of positive or negative feedback rewards small themes.
In a mobile app's reviews, a theme with 3 records that are all positive is 100% positive, and a theme with 800 records that are 90% positive looks worse, although it tells you far more about what customers think.
The Satisfaction and Dissatisfaction Scores take the number of records into account along with the share: a theme scores high only when its feedback is clearly positive (or negative) and there is enough of it to be sure. So a theme with a few records can't reach the top of either list by chance, and the themes that do reach the top affect many customers.
The scores are calculated the same way every time, so the same records always give the same scores and the same order.
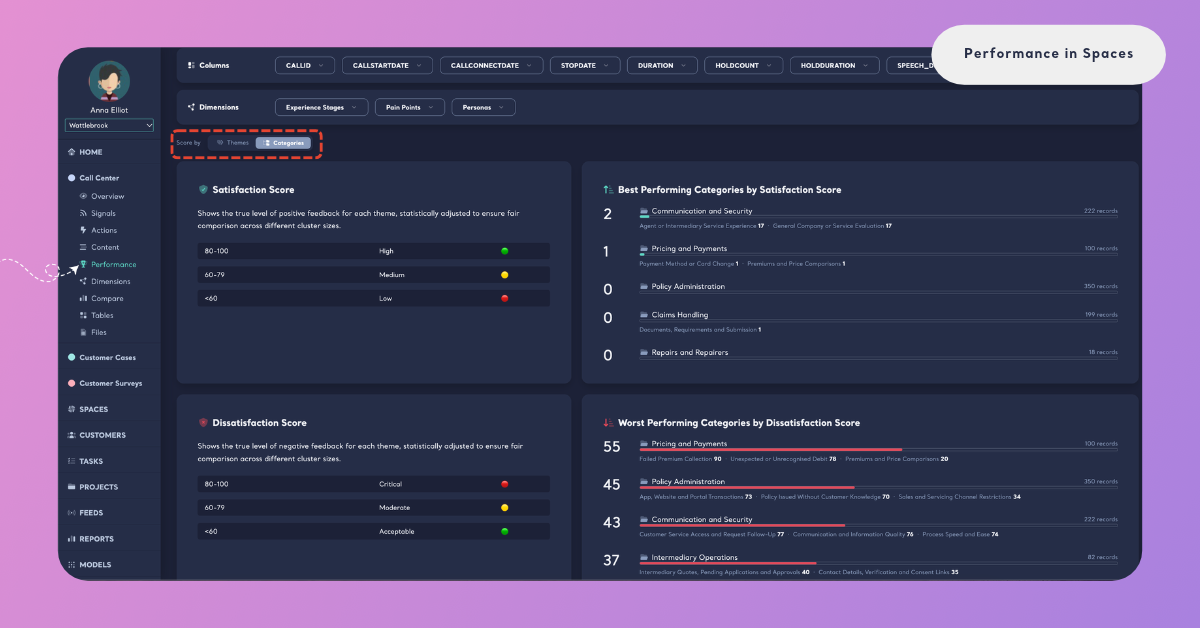
Score by Themes or Categories
Score by sets what the two lists rank. Themes, the default, scores every label of the Space's content classifier on its own: "Late Delivery", "Refund Request" or "App Login Error", for example. Use it to find the exact topics that please or upset customers.
Categories scores the categories of the content classifier, each as one group of its labels: "Delivery", "Payments" or "Mobile App", for example. The lists become Best Performing Categories by Satisfaction Score and Worst Performing Categories by Dissatisfaction Score. Each row shows the category's score and number of records, and under it up to three of its labels with their own scores, so you see which themes pull the category up or down. Use it to compare the larger areas of the customer experience, such as which part of the business draws the most dissatisfaction.
Score the Themes for a Segment
Every filter on the page changes the scores. Pick a value from Classifications, Columns or Dimensions, or choose a period, and both lists are calculated again for those records only. With no filter, the page says "No filters yet: pick labels and columns below, or choose a period, to see how the themes perform for them."
- A column value. Choose a product, a region or a channel from Columns to see which themes satisfy or upset the customers of that segment.
- A Dimension answer. Choose an answer of a Dimension, such as a Pain Point, to see which themes come with it and how customers feel about them.
- A period. Click the dates next to the Filters card to score the themes of one period, such as the last month, and compare it with the period before.
Each filter shows as a chip in the Filters card; click the cross on a chip to remove it, or Reset all to remove every filter. See Filter Records in Spaces.
The filters are kept in the page address, so a copied link opens the same view for a teammate.
When Scores Are Missing
Performance needs two things from the Space's Funnel: a content classifier that gives the themes, and a sentiment classifier that says whether each piece of feedback is positive or negative.
- No themes to score. The Funnel has no content classifier, so the records have no themes to rank. Every Space classifies its feedback with its Funnel; to score themes, the Funnel needs a content classifier. See What is a Funnel?.
- No sentiments to score by. The Space's records have themes but no sentiment, because the Funnel has no sentiment classifier. Without positive and negative feedback, neither score can be calculated.
- Low scores under narrow filters. The scores take the number of records into account, so a filter that leaves only a few records lowers every score, and a theme with no positive or negative feedback scores 0. Remove a filter or widen the period to score more records.
- A new Space. Until the first file is classified, the Space has no records to score. The page fills in once the classification is completed, and later files join the scores the same way.
If the page says "The performance could not be loaded, please try again.", reload the page.
Performance Scores and NPS
A Space also has an NPS: its share of positive feedback minus its share of negative feedback, from −100 to 100, shown on the Space's row and on its Overview. NPS tells you how the whole Space, a category or a theme is doing. The Satisfaction and Dissatisfaction Scores answer a different question: which themes matter most, by their sentiment and their volume together. That is why the Performance page and the Best Performing Themes and Worst Performing Themes cards on Overview rank themes by these scores and not by NPS. See How NPS Is Calculated in Spaces and Overview in Spaces.
How It Differs from Reports
A Report has a Performance page too, with the same Satisfaction and Dissatisfaction Scores, ranges and filters. In a Space, the page reads every classified file, so the scores change as new files join, and you can score whole categories with Score by. Every theme row also shows its category and number of records. See Performance in Reports for the Report's page.