Test a Custom Model
4 mins read - Updated on Oct 28, 2026You can test a custom model in Kimola before you use it in an analysis, to see whether it labels customer feedback the way your team would. Every custom model has a test console on its Overview page with two ways to test: Text classifies a sentence or a paragraph you type and shows its predictions as you type, and Document classifies a file of feedback by creating a Report with the model already chosen. A quick test with texts your team knows well shows whether the labels are clear enough, before the model reads thousands of records in a Report or a Space.
Custom models are available in the paid packages, not in Starter. You need a custom model to test: open Models in the main menu and click View on its row.
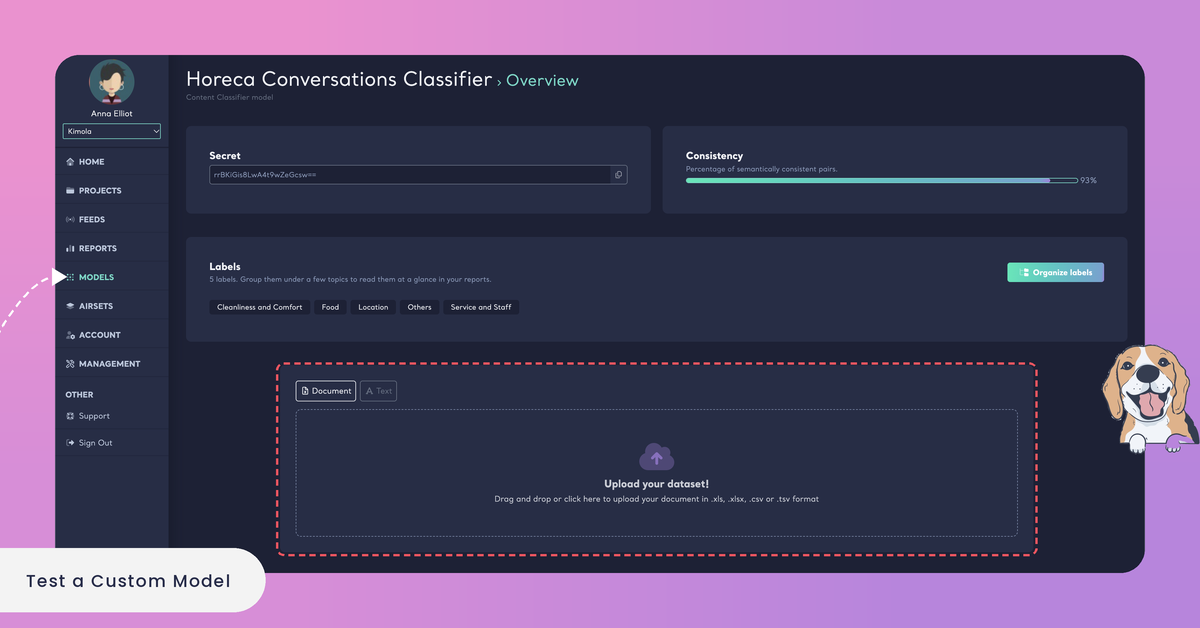
Custom models, and their test console, are available in the paid packages; the free Starter package doesn't include them (see kimola.com/pricing). If you don't have a model yet, create one with a prompt, with a training dataset or with a Report. To open the console, go to Models in the main menu and click View on the model's row. The model's Overview page shows its consistency and its labels at the top, and the test console below them. The console opens on Document.
Test with Text
A text test is the quickest way to try a model. It classifies one text at a time, right on the model's page, and creates nothing in your account. Use it to try the cases you know matter: a typical complaint, a text that mentions two topics, a short text, a text with mixed feelings.
Step 1: Open the Text Tab
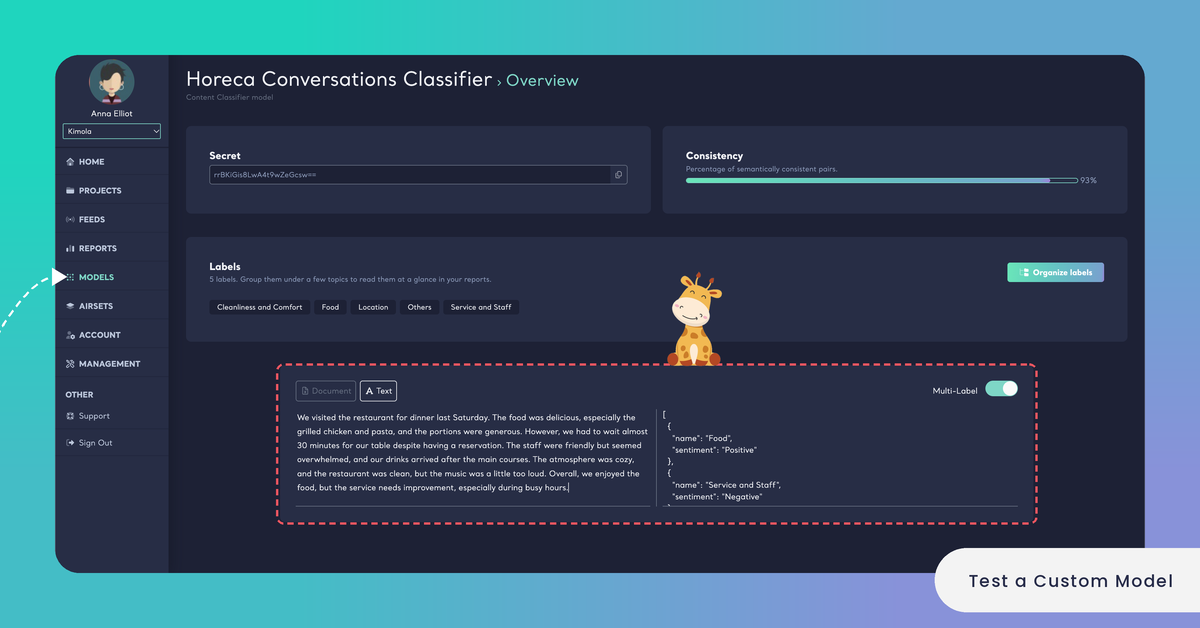
In the test console, click Text. The console splits into two boxes: the box on the left, which says "Test with your own text.", and Predictions on the right. The Multi-Label switch appears at the top right of the console, and it is on when the tab opens.
Step 2: Type or Paste a Text
Type or paste a piece of feedback into the box on the left. You don't need to press a button: once you stop typing, the model classifies the text and its predictions appear on the right in a moment. Each change you make to the text is classified again, so you can rewrite a sentence and see how the labels follow it.
Step 3: Read the Predictions
The predictions are shown as a short list in a structured format, and what each entry holds depends on the Multi-Label switch.
With Multi-Label on, the model gives every label the text matches, and each label comes with the sentiment of the text toward it, such as Negative or Positive. This is how a multi-label Report labels feedback: one review can mention several topics, and each of them gets its own sentiment.
With Multi-Label off, the model gives the single label that fits the text best, with its probability, a number between 0 and 1: the closer it is to 1, the more certain the model is. This is how a single-label Report labels feedback, under one main theme. See Multi-label vs. Single-label Classification.
Turn the switch off and on with the same text in the box to compare the two answers: the text is classified again each time.
A mobile network operator tests its model for survey answers, with the labels Coverage, Billing and Customer Support. It types "No signal at home since Tuesday, and support kept me on hold for 40 minutes." With Multi-Label on, the predictions are Coverage and Customer Support, both Negative. With Multi-Label off, the prediction is Coverage alone, with a probability of 0.87.
Test with a Document
A document test classifies a whole file of feedback with your model. It creates a Report, so you see the model's themes, sentiment and Dimensions on real data, in the same screens you will use later. It goes through the same steps as creating a Report with a custom model, with your model already chosen.
Step 1: Upload Your File
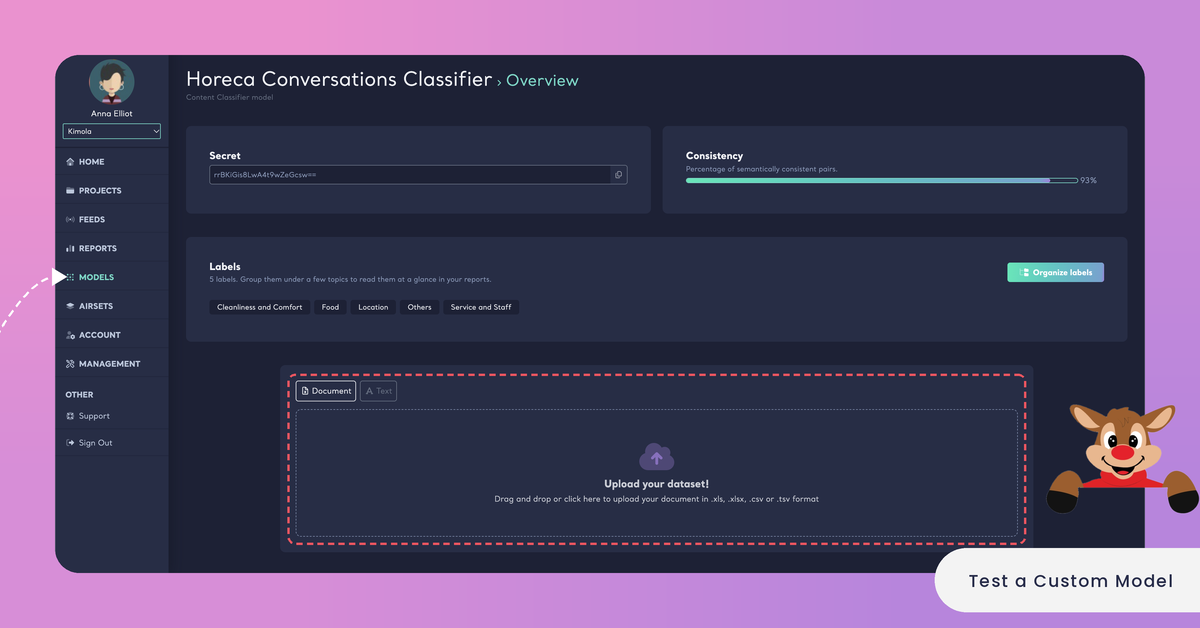
In the test console, keep Document selected. Drag and drop your file onto the upload area, or click it to choose a file. The console accepts one file at a time, in .xls, .xlsx, .csv or .tsv format and smaller than 30 MB. A small file is enough for a test: a few hundred rows your team knows well use few queries and can be checked row by row.
Upload one file in .xls, .xlsx, .csv or .tsv format, smaller than 30 MB.
Step 2: Choose the Columns
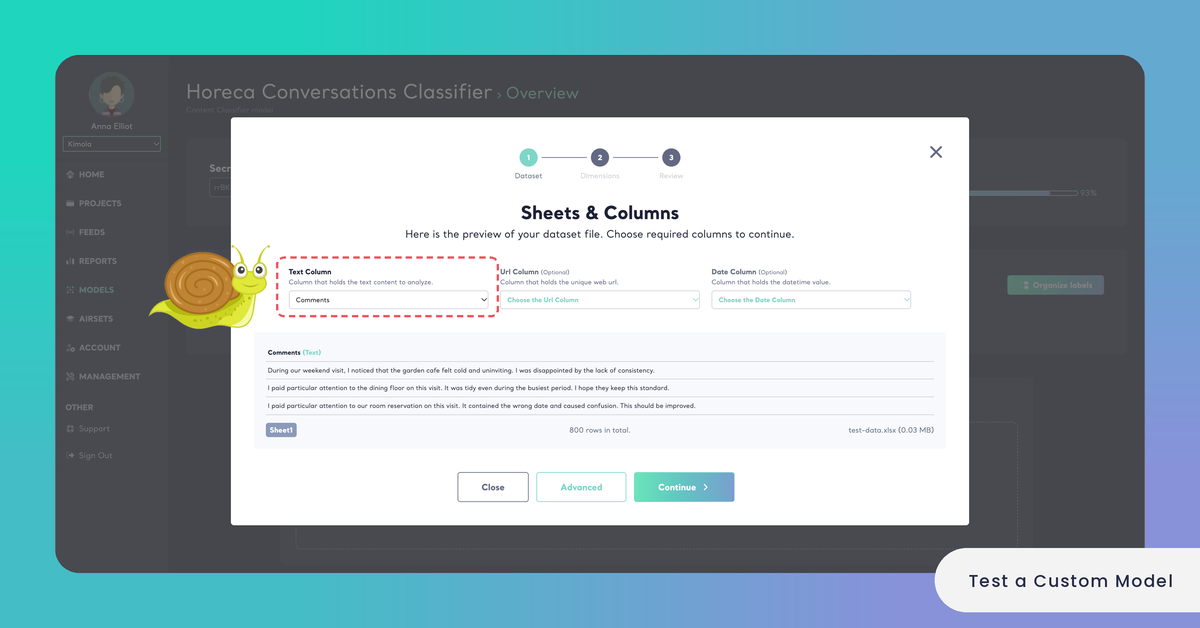
The Sheets & Columns step shows a preview of your file. Choose the Text Column, the column that holds the text to analyze. The Url Column and the Date Column are optional: a Date Column lets you see how the themes move over time. Below the preview you see the sheet the rows are read from and the number of rows in the file.
Then click Continue, or Advanced to choose the models and the structure of the Report yourself (see Step 3). Without Advanced, the Report uses the Sentiment Classifier and the Automatic Classifier next to your model, as every new Report does.
Step 3: Choose the Classifiers and the Structure (Optional)
Advanced adds two steps to the wizard. In Classifiers, your model is already selected under CUSTOM MODELS, and the Sentiment Classifier and the Automatic Classifier are selected under PRE-BUILT MODELS, as in every new Report. Clear both pretrained models to see your model's labels alone, or keep them to compare your labels with the themes the Automatic Classifier finds on its own.
In Structure, Enable Multi-label Classification decides whether a piece of feedback can get several labels, as the Multi-Label switch does in a text test. It is on when the step opens.
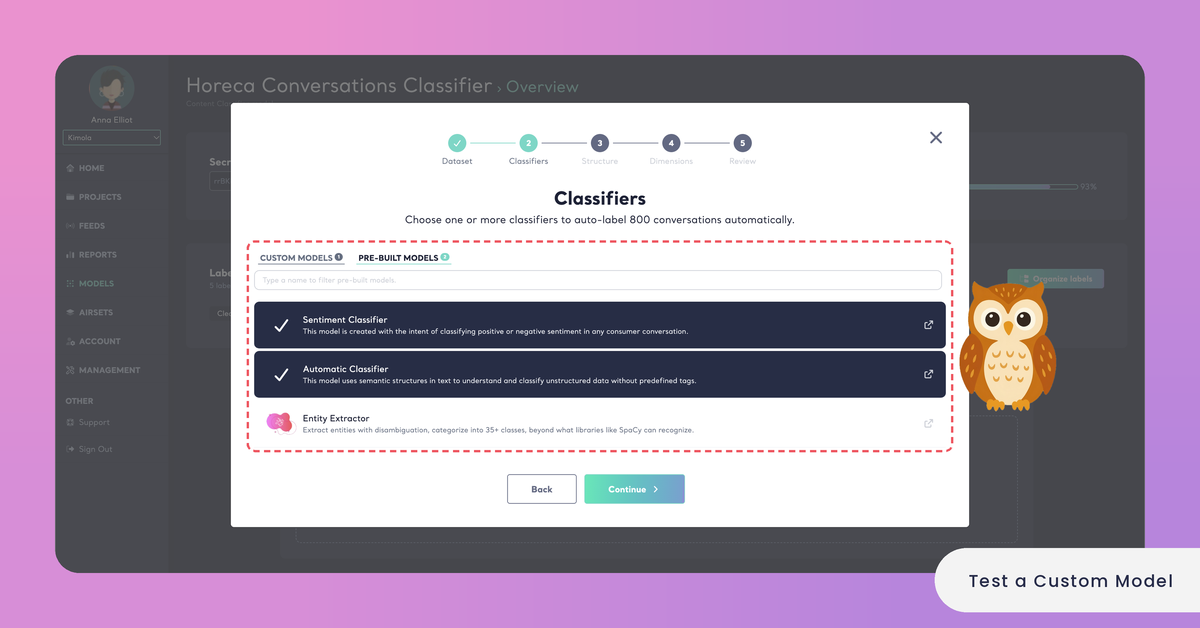
Without Advanced, the Report also uses the Sentiment Classifier and the Automatic Classifier next to your model.
Step 4: Choose the Dimensions
In Dimensions, choose the research questions you want asked of every piece of feedback, such as Pain Points or Unmet Needs, or continue without any: Dimensions are optional. The ones you choose are listed under My List. See What is a Dimension?
Step 5: Review and Create the Report
The Review step shows your choices. Report Title is optional, and Report Language is the language the Report is written in. Dataset repeats the number of rows and the file they come from, followed by Required Query. Click Create Report! to start the analysis.
A document test uses queries like any Report: one analyzed row, multiplied by the number of models and the number of Dimensions (queries = rows × models × Dimensions). Every model you keep in the Classifiers step and every Dimension you choose adds to the queries of each row.
A document test uses queries like any Report: queries = rows × models × Dimensions.
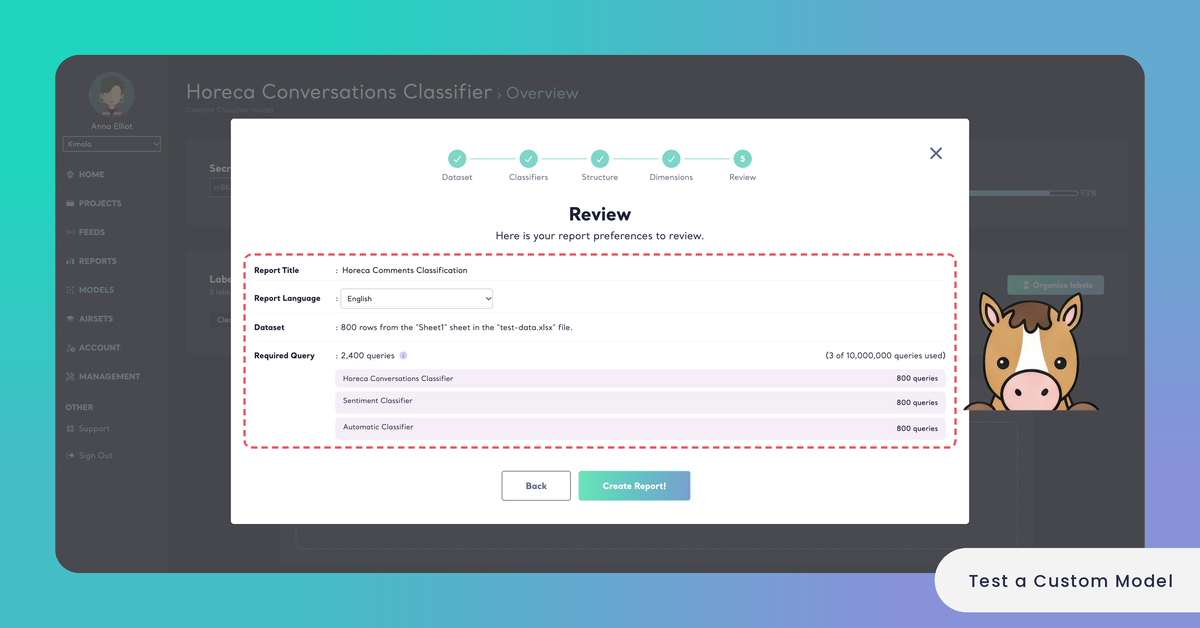
The new Report appears in Reports like any other, and you read your model's labels on its Overview and in its other screens once the analysis is complete.
Test with a few hundred rows your team knows well: they use few queries and can be checked row by row.
After the Test
When the predictions match what your team expects, the model is ready to use. Choose it when you create a Report with a custom model, or, in the Enterprise package, add it to a Funnel so that every Space using the Funnel classifies its files with it.
When they don't, look for a pattern rather than a single wrong answer. A label that is never predicted may be unclear or not needed, two labels that keep replacing each other may overlap in meaning, and texts that get no fitting label may point to a topic the model has no label for. The consistency score on the same page is a second check of how clearly the labels are told apart. Improving a model usually means creating a new version with clearer labels or a cleaner training set, and testing it on the same texts as the old one. See Optimize Prompt-Based Custom Models and Optimize Dataset-Based Custom Models.
Kimola's ready-made models have a test console of their own. See Test a Pretrained Model.