Create a Report Using a Custom Model
5 mins read - Created on Oct 14, 2025A custom model in Kimola allows you to analyze data using your own predefined labels, themes, or KPIs. Unlike automatic or pre-built classifiers, a custom model reflects your specific business logic, terminology, and analytical goals.
Once a custom model is created, it can be reused while generating reports. This makes it possible to apply the same classification structure consistently across multiple datasets, track specific topics over time, and compare results between different periods using a stable and repeatable framework.
Using a custom model is especially useful when you want to:
- Monitor defined KPIs or themes consistently
- Analyze feedback according to business-specific or research-specific categories
- Compare results across different reports without redefining labels
If you are not familiar with custom models, see What Is a Custom Model before continuing.
This article explains how to create a report using an existing custom model and how custom models work together with other classification options in Kimola.
Before creating a report using a custom model, make sure you are signed in to your Kimola account and are on the Dashboard Home page. Most importantly, ensure that you already have at least one custom AI model available in your account.
If you do not yet have a custom model to analyze your data, you can create one first using one of the following methods, depending on your workflow:
- Create a Custom Model with a Prompt
- Create a Custom Model with a Training Dataset
- Create a Custom Model with a Report
Once a custom model is available in your account, you can use it to analyze your data by creating a report with that model.
Step 1: Add Your Data
From the Dashboard Home page, start creating a new report by adding your data source. You can proceed in one of the following ways:
- Paste a link from a supported platform to collect data automatically
- Upload a custom dataset in Excel or CSV format
- Use one of the available integrations
After adding your data source, click Continue.
Step 2: Define Dataset Structure
How this step appears depends on your data source:
- If you are creating a report from a link, you can choose how many records to include and proceed.
- If you uploaded a custom dataset, you must define the required columns:
- Text column (required)
- URL column (optional)
- Date column (optional)
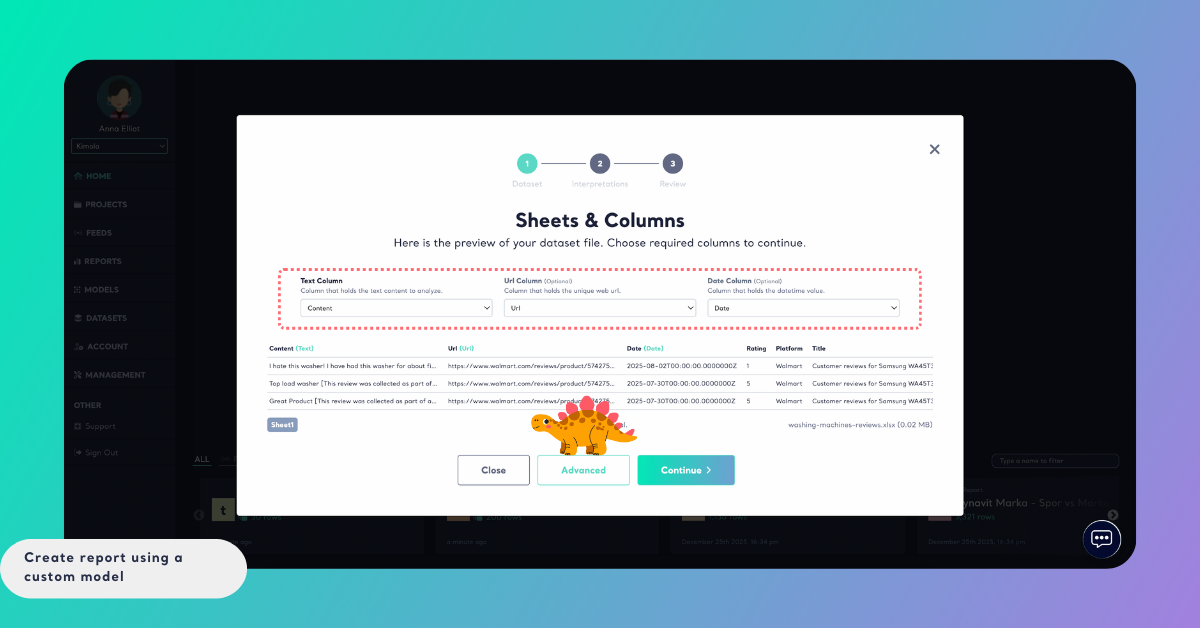
After confirming the dataset structure, click Advanced to continue with custom model selection.
Step 3: Configure Modeling Options
On the Structure & Modeling screen, you can control how classification will be applied in the report.
Here, you can:
- Enable or disable Multi-label Classification
- Enable or disable the Automatic Classifier
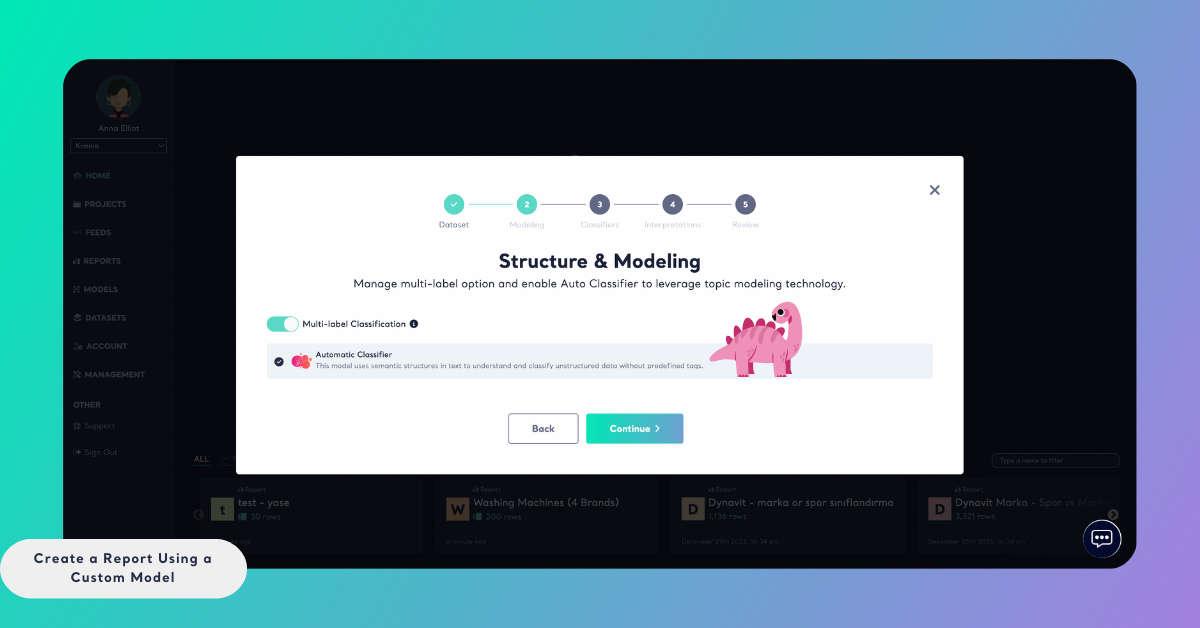
Using a custom model does not prevent you from using these options.
If enabled together:
- The report will include results from both your custom model and the automatic classifier. This allows you to compare structured, KPI-driven analysis with exploratory insights from automatic classification.
- Multi-label classification allows a single record to be associated with multiple themes
After making your selection, continue to the Classifiers step.
Step 4: Select Your Custom Model
In the Classifiers step, switch to the Custom Models tab.
From here:
- Search for your custom model by name, or
- Select it directly from the list
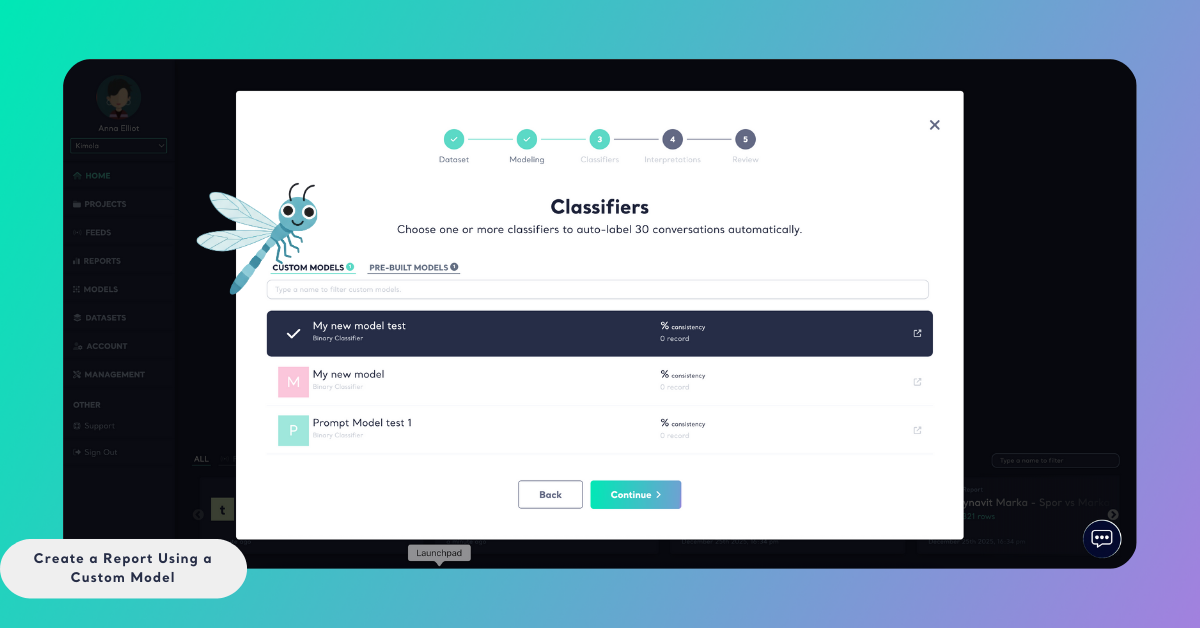
Once selected, click Continue to move to the Dimension step.
Step 5: (Optional) Select Dimensions
Kimola allows you to enrich standard classification and sentiment results with additional analytical layers called dimensions.
From this screen, you can choose dimensions such as Motivations, Pain Points, Unmet Needs, Personas, Experience Stages, Usage Contexts, and more.
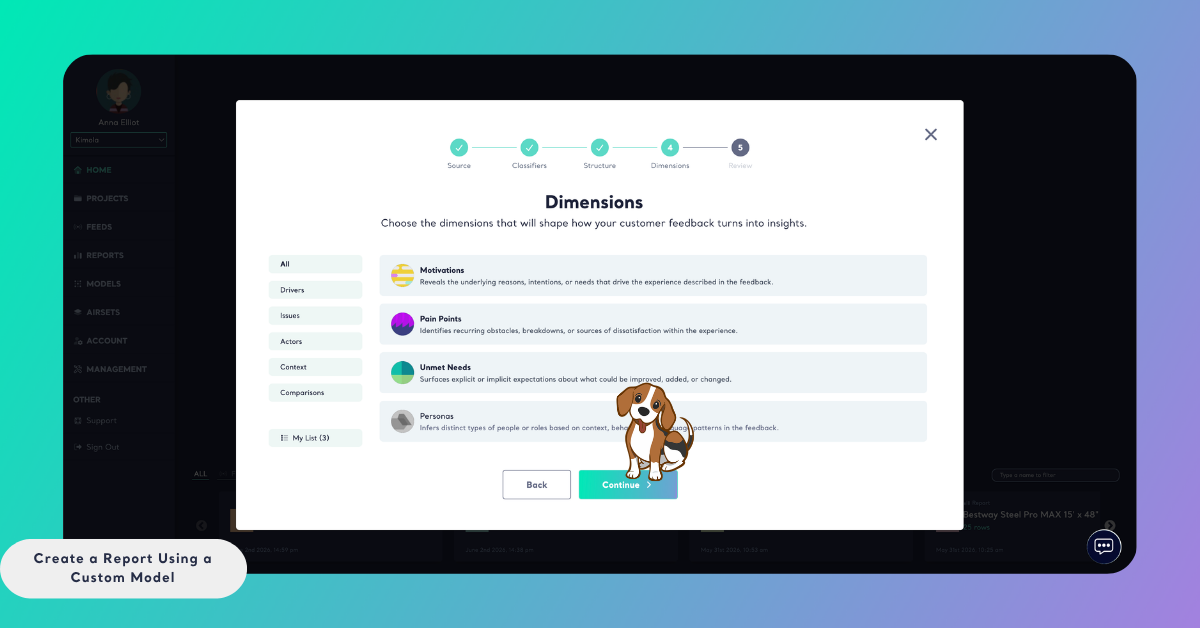
Selecting dimensions is optional. You may skip this step if you only need standard classification and sentiment outputs.
Selected dimensions appear under My List on the left side, allowing you to review and adjust them before creating the report.
Step 6: Review and Create the Report
In the final step, review your report settings:
- Report Title: Give your report a name (depending on creation method)
- Report Output: Select the output language
- Required Query: Shows how many queries will be used to generate the report
The required query count may include:
- Data collection queries (for link-based reports)
- Sentiment analysis queries applied to each record
- Queries used by automatic or custom classifiers
- Queries used by selected dimensions
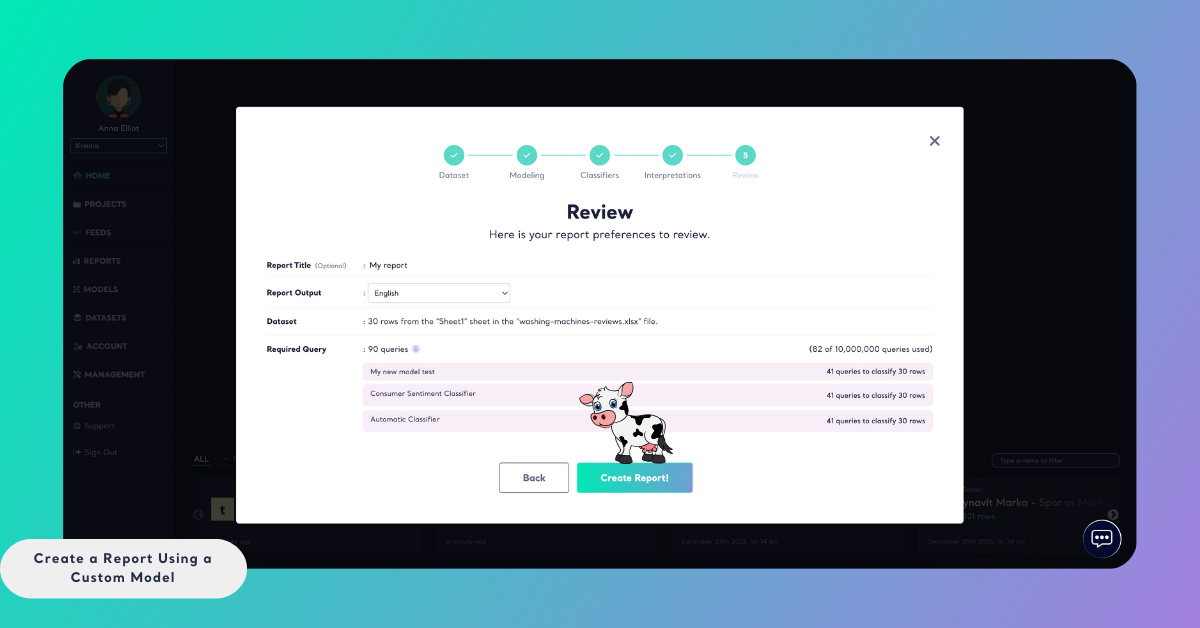
This overview helps you understand how report creation will affect your plan usage.
Click Create Report to start the analysis. Processing time may vary depending on data volume.
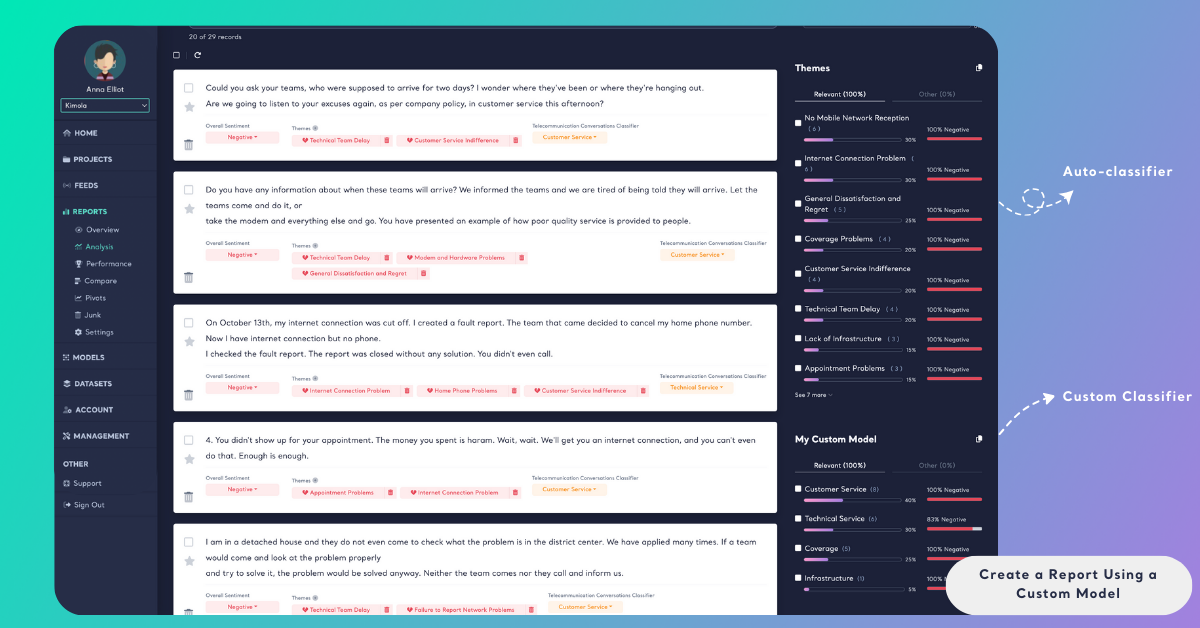
Step 7: Accessing the Results
Once analysis is complete, the report becomes available in the Reports section.
You can access all results directly from the Analysis page, where custom model labels, aspect-based sentiment are displayed together in a structured and filterable format.
By using a custom model in report creation, you can analyze customer feedback according to your own predefined structure while maintaining consistency across multiple datasets. Custom models work seamlessly with multi-label classification, sentiment analysis, and optional dimension layers, allowing you to tailor analysis depth based on your needs. This approach ensures that reports remain comparable over time and aligned with specific business or research objectives, without requiring repeated configuration for each new dataset.