Create a Report Using Pretrained Models
5 mins read - Created on Dec 25, 2025Pretrained models in Kimola allow you to analyze your data using ready-to-use classification models that are trained for specific industries, domains, or common business use cases. These models are designed to help you get structured insights quickly, without creating or training a model yourself.
Unlike the Automatic Classifier, which generates themes dynamically from the data, pretrained models use predefined labels and classification logic. This makes them especially useful when you want to analyze feedback according to established business categories or industry-specific frameworks.
Custom models, on the other hand, are designed for scenarios where predefined structures are not sufficient. They allow you to define your own labels, themes, or KPIs and train the model according to your specific business logic or research goals.
This article explains how to create a report using a pretrained model and how pretrained models fit into Kimola’s reporting workflow.
Before creating a report using a pretrained model, make sure you are signed in to your Kimola account and are on the Dashboard Home page. Your dataset must include a text column suitable for analysis. No model training, data labeling, or model creation is required to use pretrained models.
Before starting the analysis, it is recommended to review the available pretrained models and ensure that one of them matches the type of data and business context you want to analyze.
Step 1: Add Your Data
From the Dashboard Home page, start creating a new report by adding your data source. You can proceed using one of the following methods:
- Paste a link from a supported platform to collect data automatically
- Upload a custom dataset in Excel or CSV format
- Use one of the available integrations
To see all supported platforms and learn about platform-specific requirements, refer to the Supported Platforms for Creating Reports from Links article.
Step 2: Define Dataset Structure
The configuration shown in this step depends on how you added your data.
If you are creating a report from a link, you can review the data collection settings and choose how many records to include before continuing.
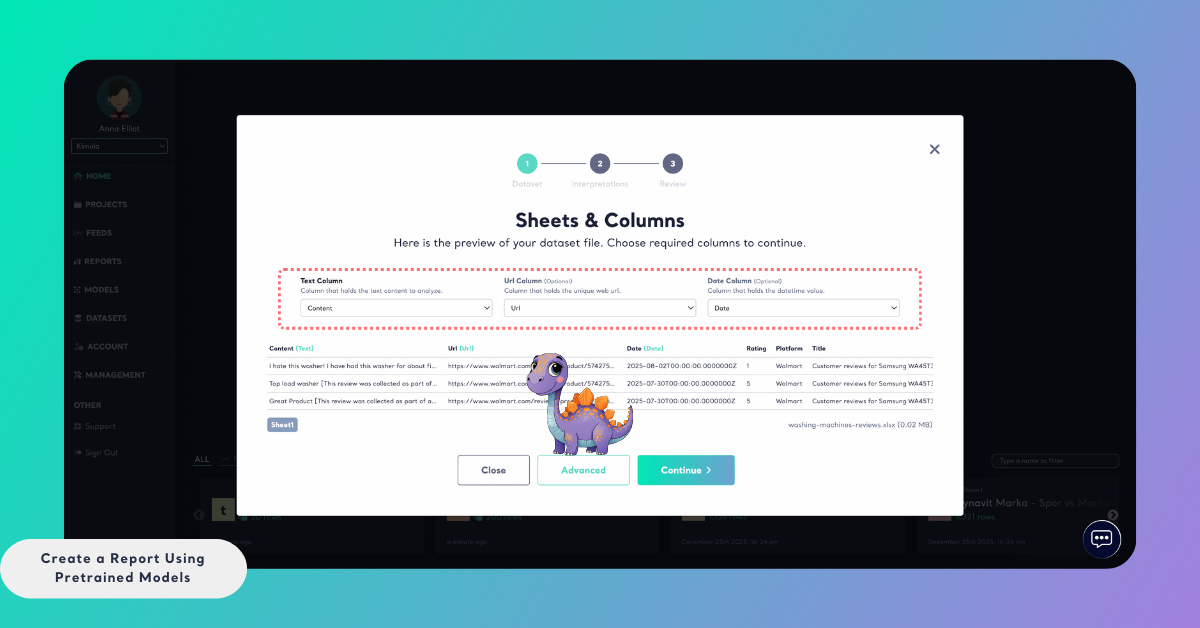
If you uploaded a custom dataset, you need to map the required columns so Kimola can process the data correctly. Select:
- A Text column that contains the content to be analyzed
- An optional URL column if source links are available
- An optional Date column to enable time-based analysis
After confirming the dataset structure, click Advanced to continue.
Step 3: Review Classification Options
On the Structure & Modeling screen, you can review how classification will be applied in the report.
Multi-label classification is enabled by default. This means a single record can be associated with multiple themes if it contains more than one topic, and sentiment will be calculated separately for each theme. If your analysis requires a single-label structure, you can disable multi-label classification at this step.
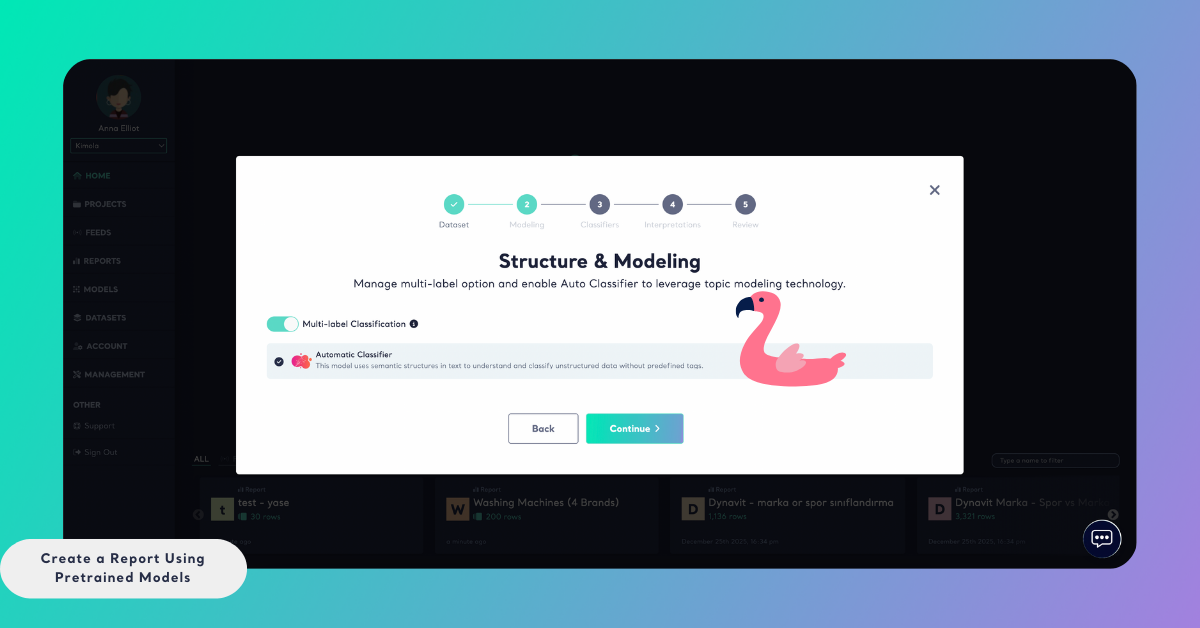
At this stage, you can also choose whether to keep the Automatic Classifier enabled. Using a pretrained model does not prevent you from using the Automatic Classifier at the same time. If both are enabled, the report will include results from the pretrained model alongside automatically generated themes, allowing you to compare structured classifications with exploratory insights.
After reviewing these options, continue to the Classifiers step.
Step 4: Select a Pretrained Model
In the Classifiers step, switch to the Pre-built Models tab.
From here, you can browse or search for the pretrained model that best matches your dataset and analysis goal. Each pretrained model is designed for a specific context, such as customer experience, product feedback, or industry-specific analysis.
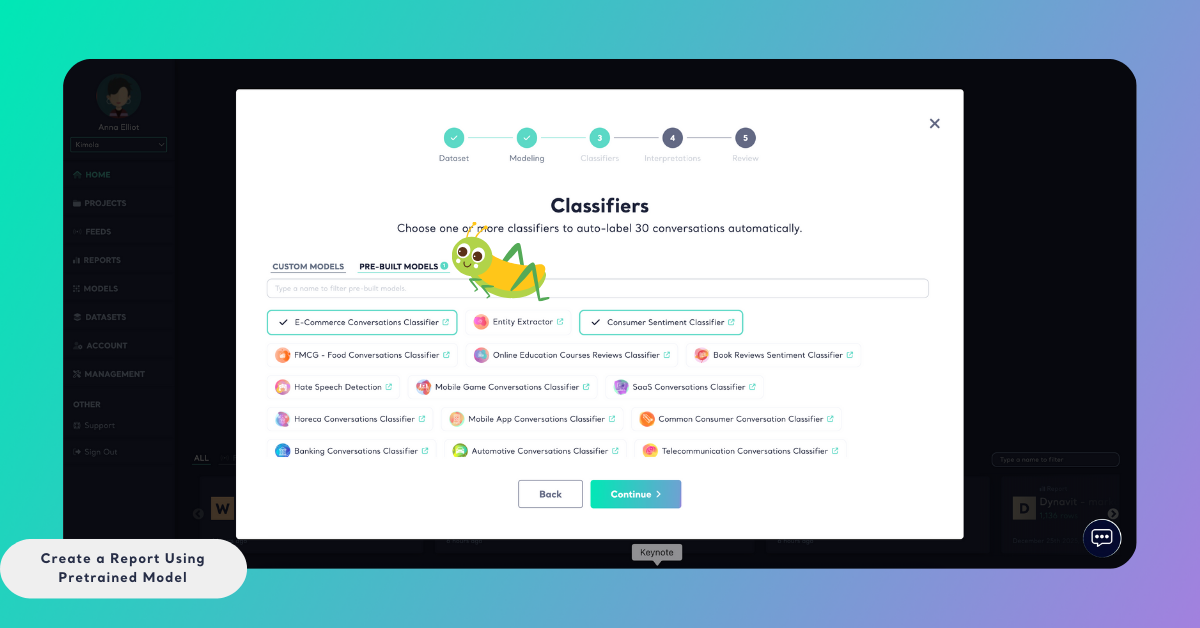
Select the model you want to use and click Continue.
Step 5: (Optional) Select Dimensions
In this step, you can choose to add dimensions to your report. Dimensions provide additional analytical layers that organize customer feedback into structured categories such as motivations, pain points, unmet needs, personas, and usage contexts.
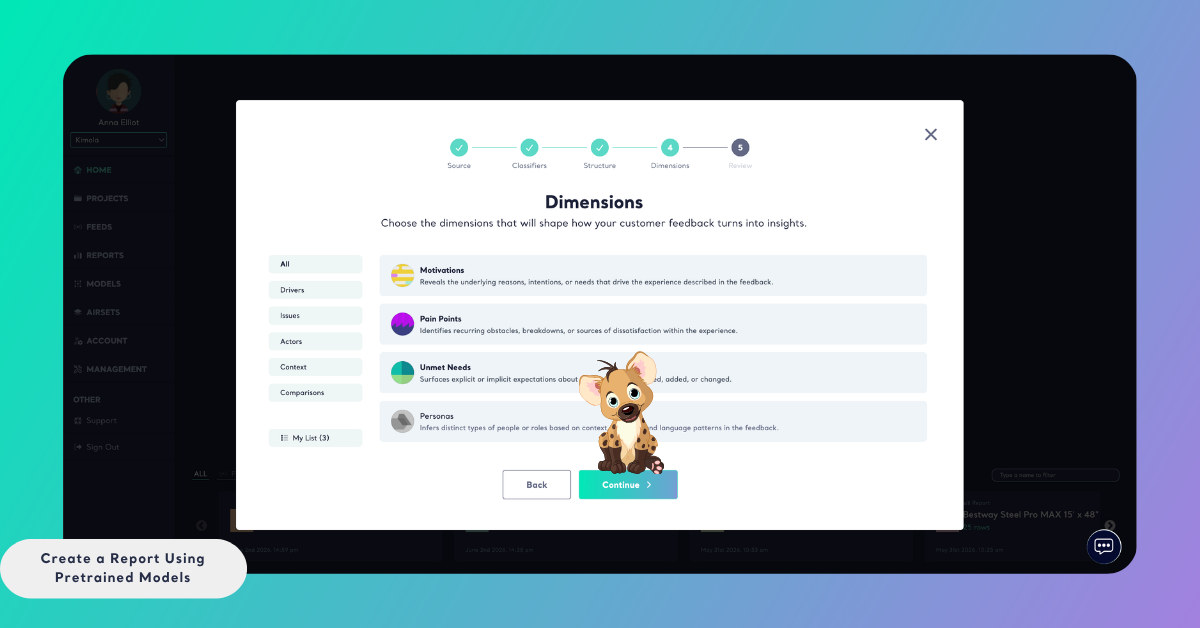
Selecting dimensions is optional. If you only need theme-level classification and sentiment analysis, you can skip this step and continue without adding any dimensions.
Step 6: Review and Create the Report
In the final step, review your report settings:
- Report Title: Give your report a name so it can be easily identified later
- Report Output Language: Select the language in which report outputs will be generated
The selected output language affects only the report outputs and dimensions. The original data is analyzed in its original language and is not translated.
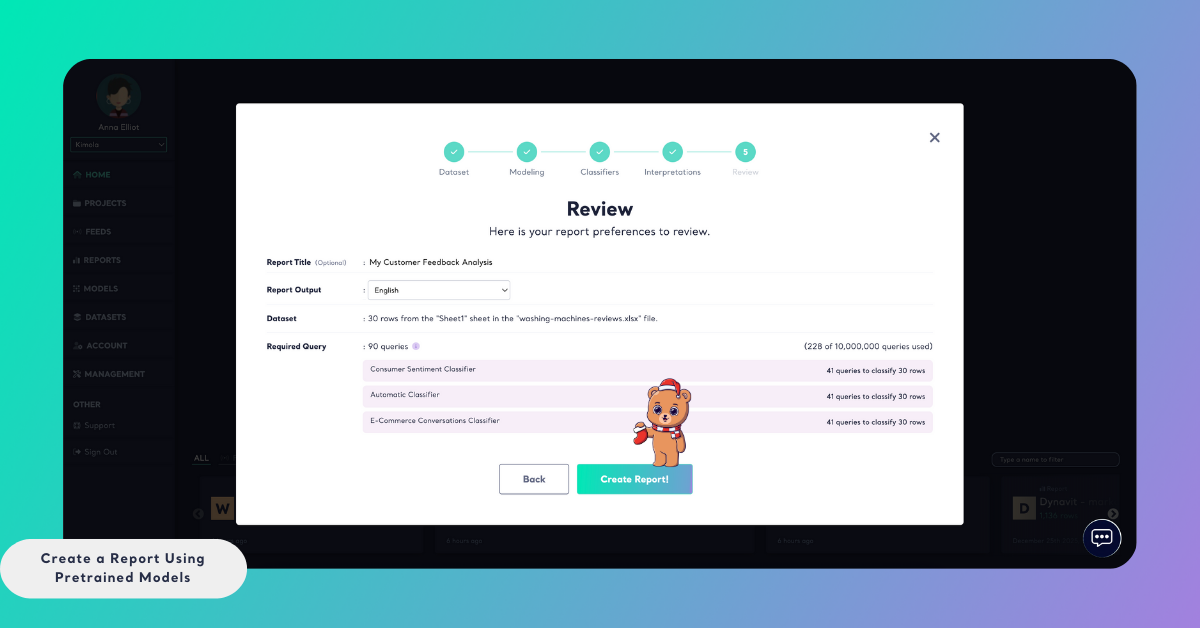
You will also see the Required Query count, which shows how many queries will be used during data collection, classification, sentiment analysis, and selected dimensions. This helps you understand how the report will impact your plan usage.
Click Create Report to start the analysis. Processing time may vary depending on data volume.
Accessing the Results
Once the analysis is complete, the report becomes available in the Reports section. You can access all results from the Analysis page, where pretrained model labels, theme-level sentiment, and any selected dimensions are displayed in a structured and filterable format.
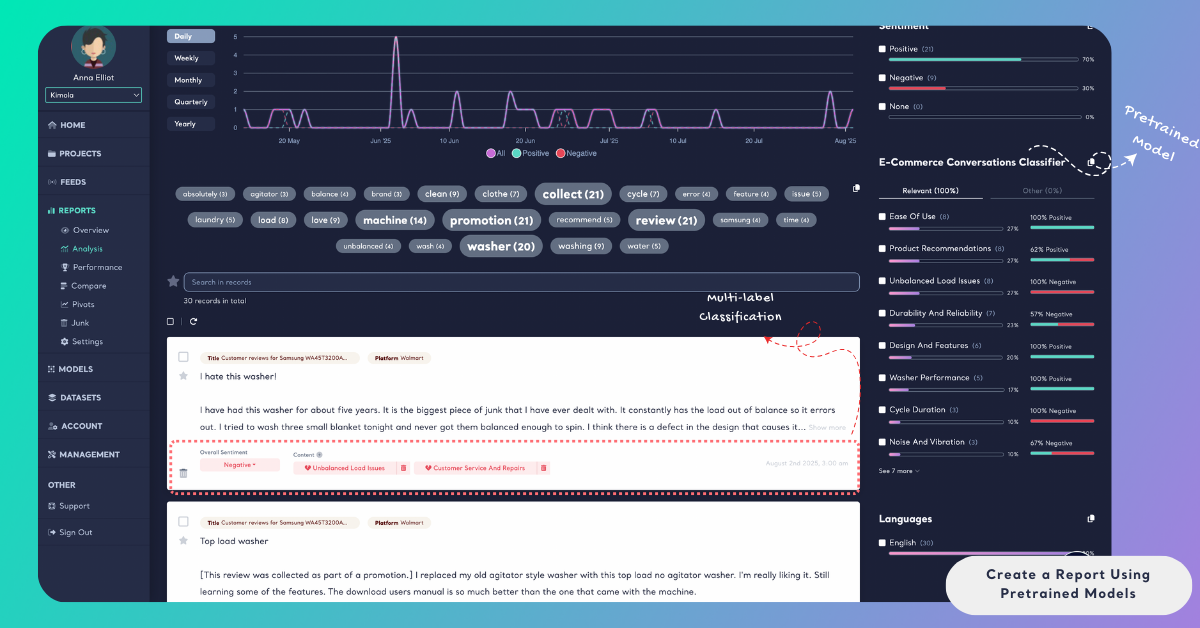
Pretrained models are most useful when you want to analyze feedback using predefined business or industry categories without building a model yourself. They provide a balance between structure and speed, making them ideal for standard reporting, recurring analyses, and teams that want consistent classification without setup overhead.