Create a Report Using Automatic Classifier
5 mins read - Updated on Dec 29, 2025The Automatic Classifier in Kimola allows you to analyze datasets without creating or training a model in advance. This means there is no need for data annotation, manual labeling, or a separate training process before generating a report.
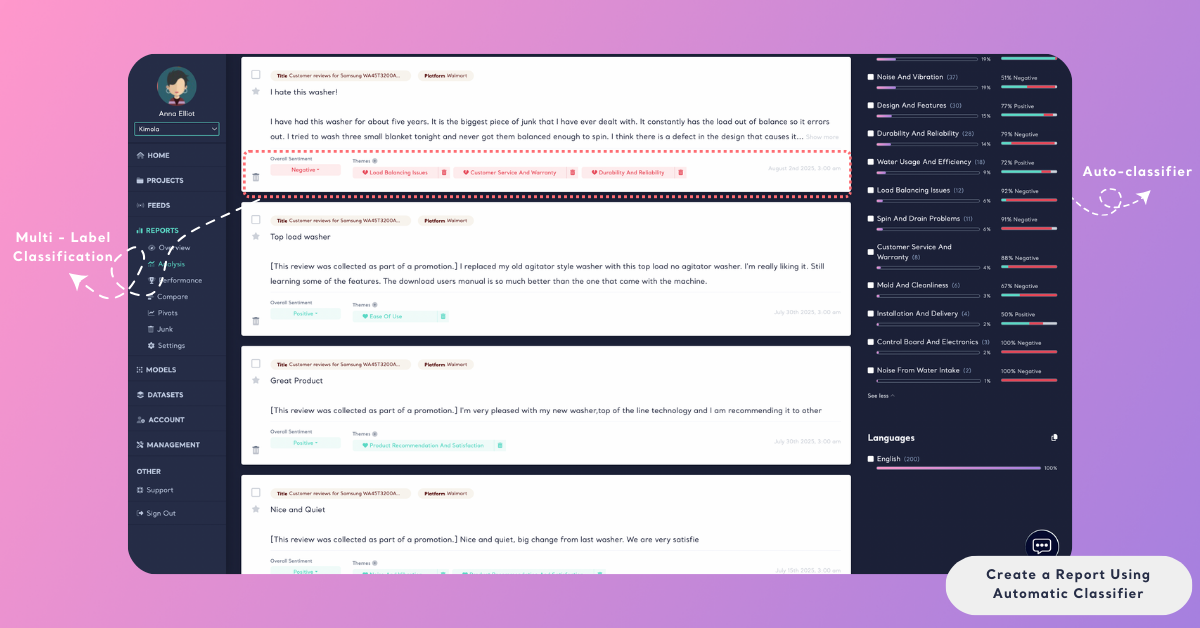
When the Automatic Classifier is enabled, Kimola applies its Dynamic Classification™ technology to the dataset during report creation. The system analyzes the context of the text, identifies meaningful patterns, and automatically groups related feedback into themes with relevant label names. These themes are generated dynamically based on the content itself, rather than relying on predefined tags or a fixed taxonomy.
Because no training process is required, the Automatic Classifier is best suited when you want to explore a new dataset, do not yet have predefined labels, or need quick qualitative insights without preparation. It can be used with unstructured data such as online reviews, open-ended survey responses, social media posts, or customer messages, regardless of industry or domain.
This article explains how to create a report using the Automatic Classifier and how this classification method works within Kimola’s reporting workflow.
Before creating a report using the Automatic Classifier, make sure that:
- You are signed in to your Kimola account
- You are on the Dashboard Home page
- Your dataset includes a text column suitable for analysis
No model creation, training, or labeling is required to use the Automatic Classifier.
Step 1: Add a Data Source
To begin creating a report, start from the Dashboard Home page and add the data you want to analyze.
Kimola supports multiple data input methods. You can:
- Enter a URL from a supported platform to collect data automatically
- Upload an existing dataset in Excel or CSV format
- Select one of the available integrations to import data
Once your data source is added, click Continue to move to the next step of report creation.
For a full list of supported platforms and platform-specific details, see Supported Platforms for Creating Reports from Links.
Step 2: Define the Dataset Structure
In this step, you configure how Kimola should interpret your data. The options shown depend on the type of data source you selected.
- For link-based reports, you can review the data collection settings and choose how many records to include before proceeding.
- For uploaded datasets, you need to map the columns in your file so Kimola can analyze the data correctly. You should select:
- a Text column that contains the content to be analyzed
- optionally, a URL column if source links are available
- optionally, a Date column to enable time-based analysis
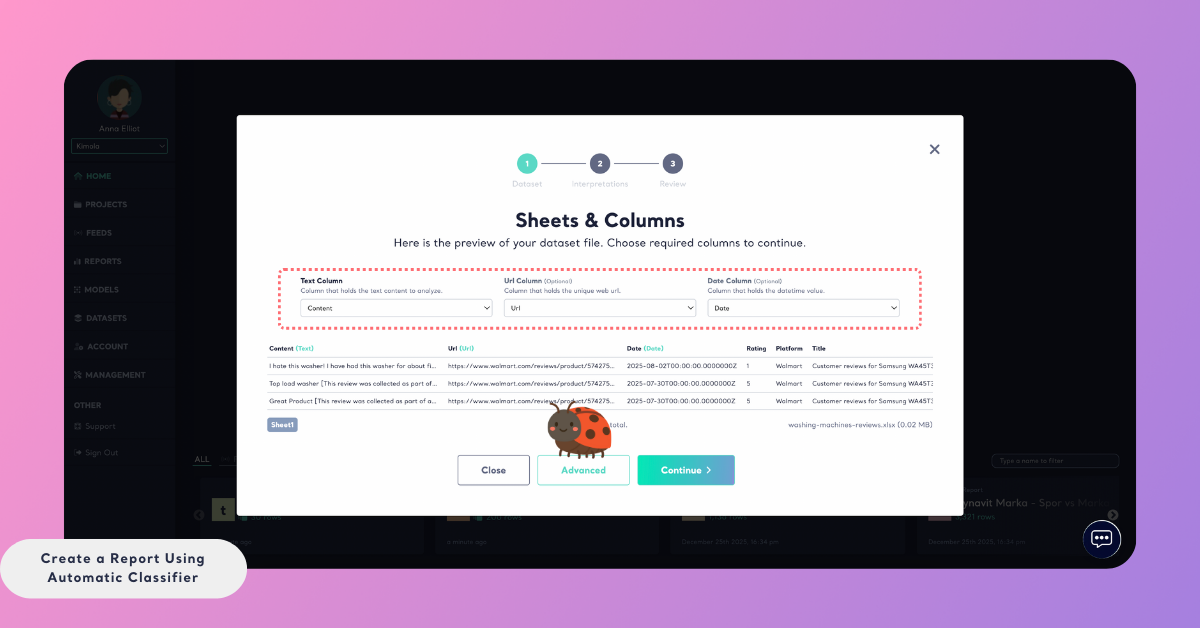
After confirming the dataset structure, click Continue to proceed with report creation.
Step 3: Review Classification
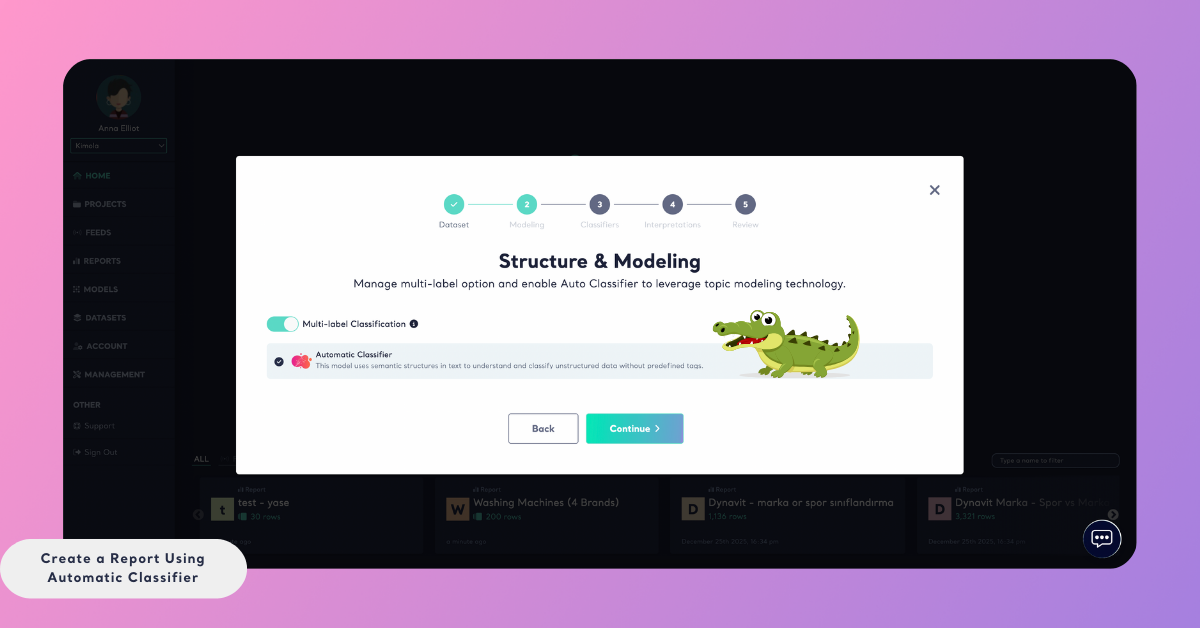
Once your dataset is ready, the Automatic Classifier is enabled by default. This means your data will be analyzed automatically without any training, manual labeling, or additional configuration. At this stage, you can continue to the next step without making any changes if you want to use automatic classification.
While reviewing this step, it’s important to note that multi-label classification is also applied by default. A single record can be associated with multiple themes if it contains more than one topic, and sentiment is calculated separately for each theme. This ensures that feedback covering multiple aspects is analyzed in full, without being limited to a single category. If you prefer to work with a single-label structure, multi-label classification can be disabled at this stage. When disabled, each record is assigned to only one theme, and secondary topics mentioned in the same feedback are not included in the analysis.
If you prefer not to use the Automatic Classifier, Kimola also allows you to analyze your data using alternative classification approaches. Instead of automatic classification, you may choose to apply an existing custom model that reflects your own labels or KPIs, or one of Kimola’s pretrained, business-specific models designed for certain industries or use cases. These options still support multi-label classification and theme-level sentiment analysis, but follow a predefined classification structure.
To learn more about these alternatives, you can refer to the following guides:
After reviewing classification and dimension options, you can proceed to the next step and continue creating your report.
Step 4: Select Dimensions (Optional)
On this screen, you can choose whether to add dimensions to your report. Dimensions are analytical layers that organize customer feedback into structured categories such as motivations, pain points, unmet needs, personas, experience stages, and usage contexts.
Dimensions help uncover deeper qualitative patterns and contextual relationships beyond standard analysis results such as sentiment and themes. They do not change the underlying dataset or classification structure. Instead, they add an additional analytical layer on top of existing report analysis.
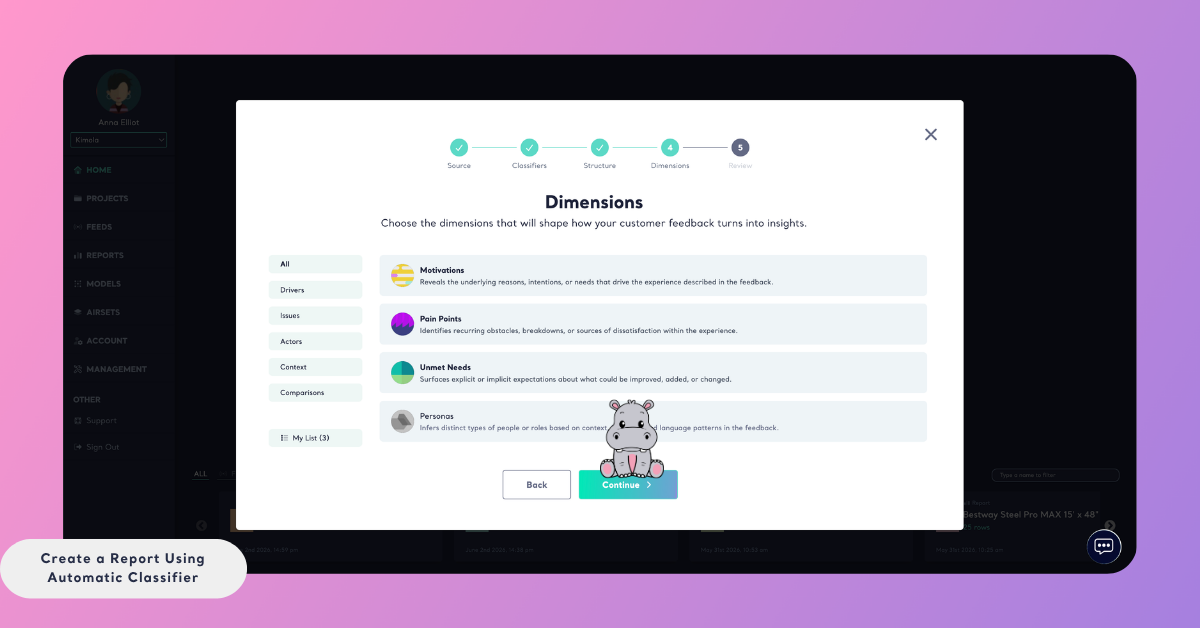
Adding dimensions is optional. If your goal is limited to standard sentiment and classification analysis, you can skip this step and continue without selecting any dimensions.
After reviewing your selections, proceed to the final step to complete report creation.
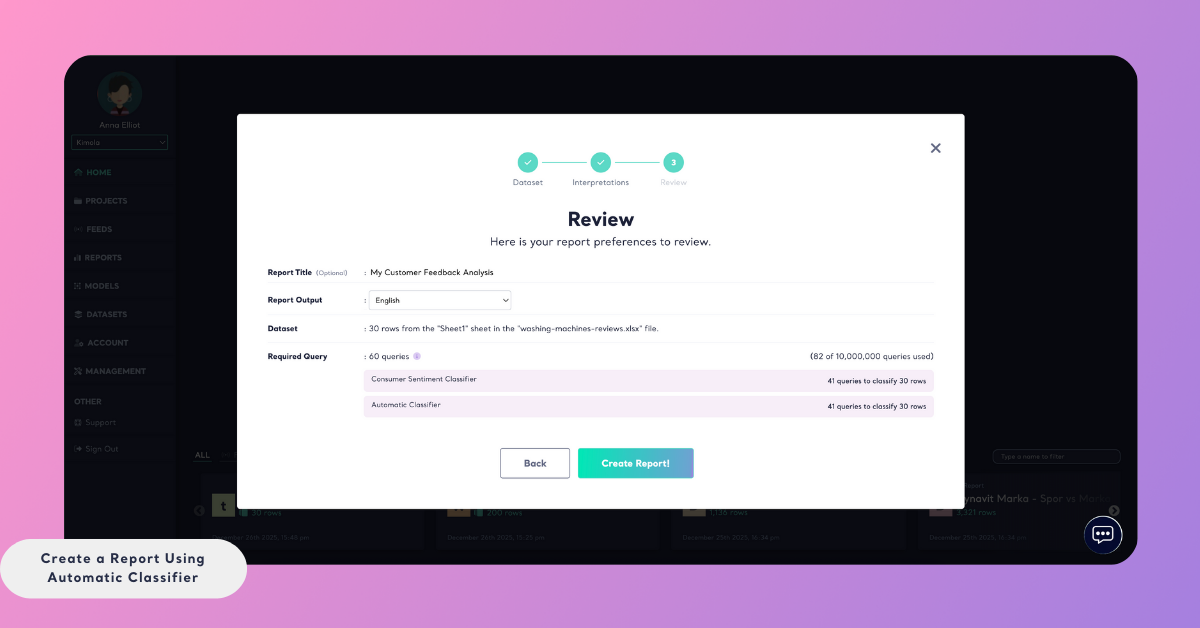
Step 5: Finalize Report Settings and Create the Report
In the last step, you complete the report setup:
- Report Title: Give your report a name so it can be easily identified later.
- Report Output Language: Choose the language in which the report outputs will be generated. Available options include English, Spanish, French, German, Portuguese, and Turkish.
The selected output language affects only the report outputs and dimensions. The original data is analyzed in its original language; the content itself is not translated.
On this screen, you will also see the required query count for creating the report. This shows how many queries will be used during data collection, classification, sentiment analysis, and any selected dimensions. Reviewing this information helps you understand how the report will impact your plan usage.
When you are ready, click Create Report to start the analysis. Processing time may vary depending on the size of your dataset.
Once the analysis is complete, the report will be available in the Reports section, and you can view all results from the Analysis page.