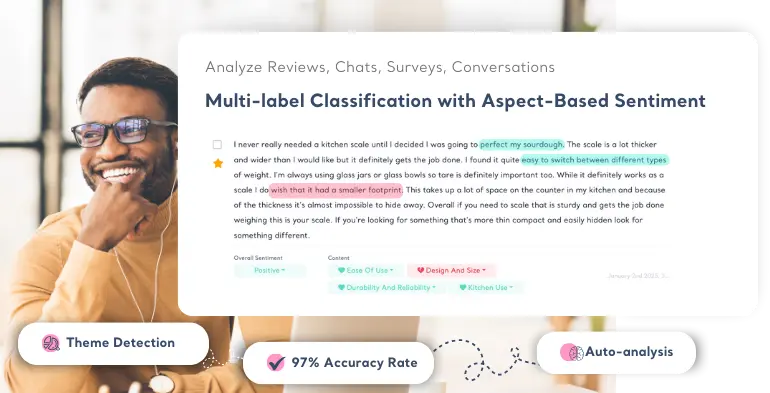
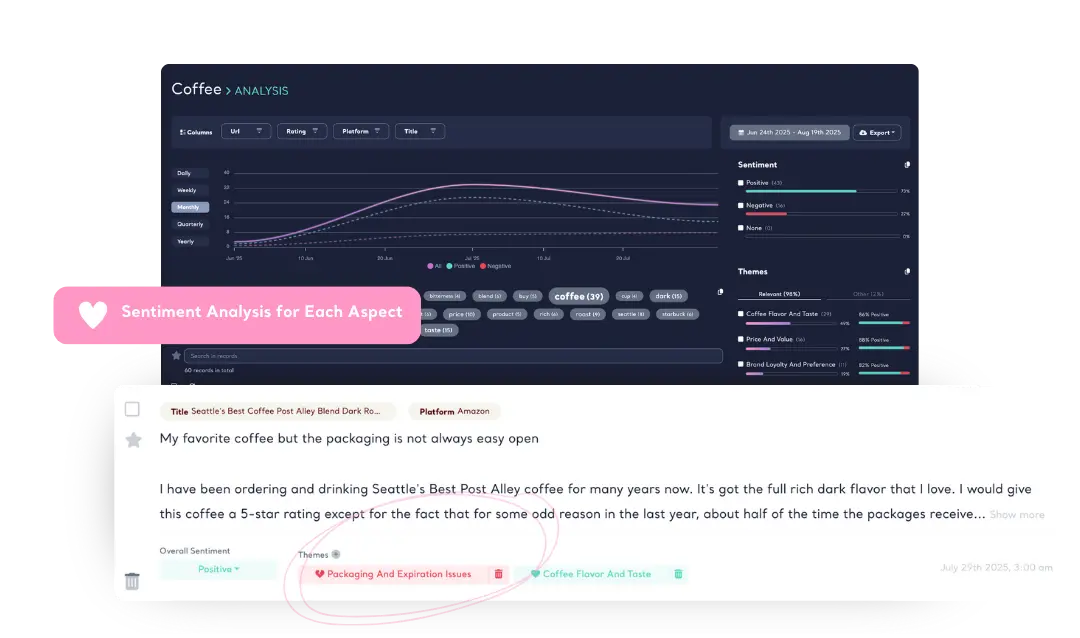
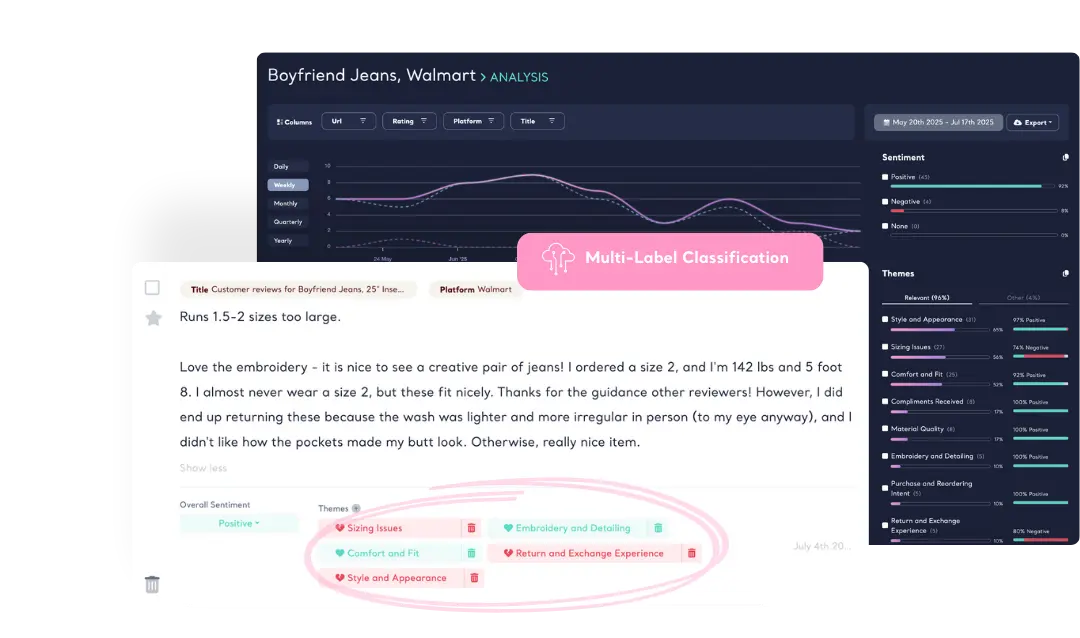
Aspect Based
Sentiment Analysis
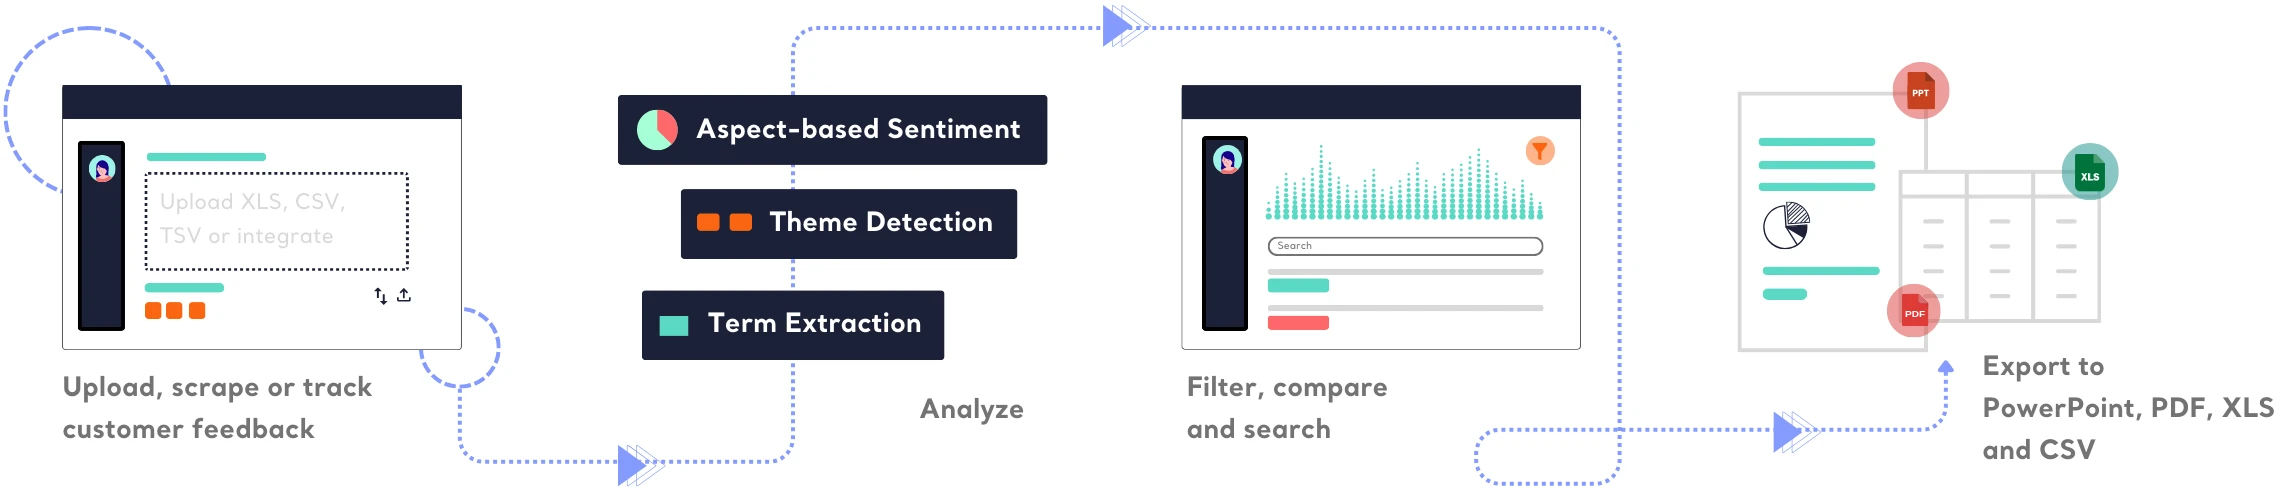
Kimola breaks down feedback into themes, assigning sentiment to each—so you see exactly what excites customers and what holds them back.
Create a Free Account
No credit card · No commitment