How to Calculate Queries?
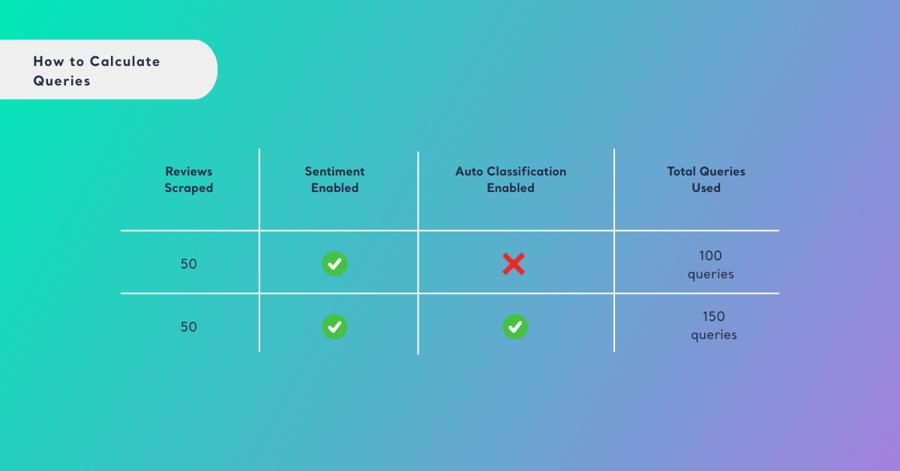
3 mins read - Updated on Nov 04, 2026A query is the unit Kimola uses to count the analysis work in your package. Kimola counts queries with one rule wherever it classifies feedback: every analyzed row, multiplied by the number of models and the number of Dimensions it is classified with (queries = rows × models × Dimensions). A Report of 1,000 reviews classified with 2 models and 3 Dimensions uses 6,000 queries. Kimola shows the queries an analysis needs before it starts, and the Usage page under Account shows what you have used in each billing period.
What Is a Query?
A query stands for the work Kimola does when it classifies your feedback. Three numbers determine how many queries an analysis uses, and they are multiplied together.
- Rows are the pieces of feedback Kimola analyzes: the rows of a file or a spreadsheet that have text in the Text Column, the reviews collected from links, the tickets of Zendesk or the conversations of Intercom, the records of an Airset or a Feed you turn into a Report, and the rows of a file you add to a Space.
- Models are the classifiers the feedback is classified with: the Automatic Classifier, the Sentiment Classifier, any other pretrained model or one of your custom models. Every model counts once, pretrained or custom. See What is a Model?.
- Dimensions are the research questions you choose, such as Pain Points or Unmet Needs. See What is a Dimension?. Dimensions are optional; when you choose none, only rows and models are multiplied: queries = rows × models.
Two things don't change the count. The length of a piece of feedback doesn't matter: a short review and a long support conversation are one row each. Whether a row gets one label or several doesn't matter either, because the structure you choose doesn't change the queries (see Multi-label vs. Single-label Classification).
For an online course platform, 2,000 course reviews analyzed with the Automatic Classifier and the Sentiment Classifier use 2,000 × 2 = 4,000 queries. With the Motivations, Pain Points and Personas Dimensions added, the same Report uses 2,000 × 2 × 3 = 12,000 queries.
Queries are spent only when Kimola analyzes data. Opening a Report, browsing and searching its records, applying filters, moving between its pages and exporting its results use no queries. Training a custom model from a training dataset uses queries by the same rule: it is one model with no Dimensions, so every row of the training set is one query (see Create a Custom Model with a Training Dataset). Requests to the Kimola API that classify text use queries from the same package.
Queries are the only unit you spend on analysis. There are no separate credits to buy for the texts Kimola writes about your results. How many queries each package includes per billing period is listed at kimola.com/pricing.
Queries in Reports
A Report uses queries once, when Kimola analyzes its data. The rule is the same for every source of a Report: a file you upload, links, an integration (Zendesk, Intercom or Google Sheets), an Airset or a Feed. The rows are the ones the Report analyzes. For a file or a spreadsheet, rows with an empty Text Column are left out and not counted. For links, the rows are the reviews collected from the pages, up to the report size you set with the slider.
For a hotel group, a Report of 1,500 reviews collected from the Google Maps pages of 3 branches, analyzed with the Automatic Classifier, the Sentiment Classifier and the Social Context Dimension, uses 1,500 × 2 × 1 = 3,000 queries.
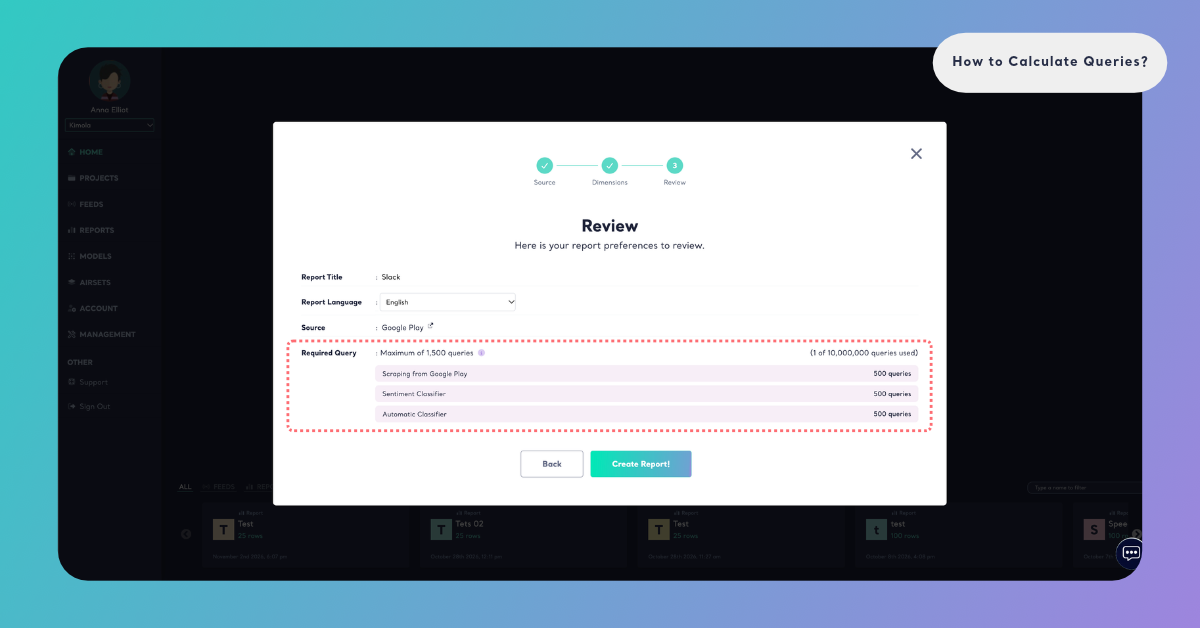
Every Report wizard ends with a Review step that shows the Required Query before anything is analyzed. Check it there. If the number is higher than you planned, go back and remove a model or a Dimension, or analyze fewer rows.
If your package doesn't have enough queries left for every row, the Review step says so before you continue. If you go ahead, Kimola analyzes as many rows as your remaining queries cover and leaves the rest out; nothing is charged beyond your package.
With too few queries left, only part of the data is analyzed. The Review step tells you before you continue.
After a Report is created, its queries are not spent again. Adding a Dimension to a Report that is already analyzed is the exception: Kimola classifies the Report's existing records with that Dimension, so it uses queries, and the Review step shows the Required Query before it starts. See Add Dimensions to a Report.
Queries in Feeds
A Feed tracks mentions and reviews from the keywords and links you give it, and keeps collecting new content. Creating a Feed uses no queries. Each piece of content the Feed collects uses 1 query, whatever its length: first when the Feed starts collecting, then every time new content arrives.
Keywords and links are limits of their own. Your package sets how many keywords and links your Feeds can track at the same time, and the Usage step of the Feed wizard shows how many the new Feed will use and how many will remain in your package. Feeds are not part of the Starter package.
When you create a Report from a Feed's records, the Report uses queries by the Report rule: rows × models × Dimensions, where the rows are the records the Report analyzes. See Create a Report in Feeds.
For an online fashion store, a Feed that collects 400 mentions in a week uses 400 queries that week. A Report made from those 400 mentions with the Sentiment Classifier and the Automatic Classifier uses 400 × 2 = 800 queries more.
Queries in Spaces
A Space uses queries every time you add a file. Spaces are available in the Enterprise package. Kimola classifies a file's rows with the Space's Funnel as soon as the file is uploaded, by the same rule: rows × models × Dimensions, where the rows are the rows of the file, the models are the classifiers of the Funnel and the Dimensions are the Dimensions of the Funnel.
Before you upload, the Summary of the Upload step shows the queries the file will use. If your package has no queries left, the upload doesn't start and the step says "Your plan has no queries left to classify this file." The steps are in Add Files to a Space.
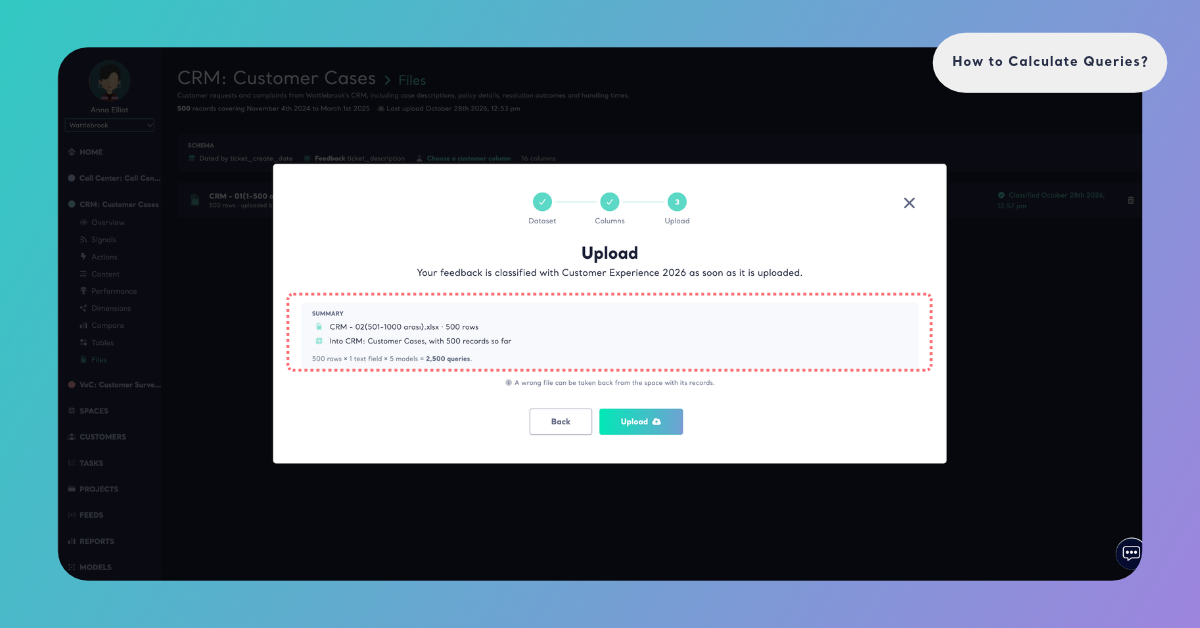
For a bank, a call center Space whose Funnel has a content classifier, a sentiment classifier and the Pain Points and Underlying Causes Dimensions classifies a monthly file of 3,000 transcripts with 3,000 × 2 × 2 = 12,000 queries.
A file's queries are spent once. Records already in a Space are not classified again when its Funnel changes, and setting a Customer Column later gives the existing records their customers without classifying them again. Taking a file back doesn't refund the queries it used, and uploading the same file again uses its queries again.
Taking a file back doesn't refund its queries. Uploading the same file again uses them again.
Dimensions and Queries
Dimensions multiply the queries of every row, so they change your usage more than anything else you choose. A Report with 3 Dimensions uses 3 times the queries of the same Report with 1, and one with all 10 Dimensions uses 10 times as many. Choose the Dimensions your research question needs.
For a mobile app, 5,000 App Store and Google Play reviews with 2 models use 10,000 queries with Pain Points alone, and 30,000 queries with Pain Points, Unmet Needs and Experience Stages.
In the Report wizard, the Dimensions you choose appear under My List, so you can review them before the Review step shows the Required Query. You can also start with fewer Dimensions and add others to the Report later, from its Dimensions page.
Start with the Dimensions you need now. You can add others to the Report later from its Dimensions page.
Track Your Usage
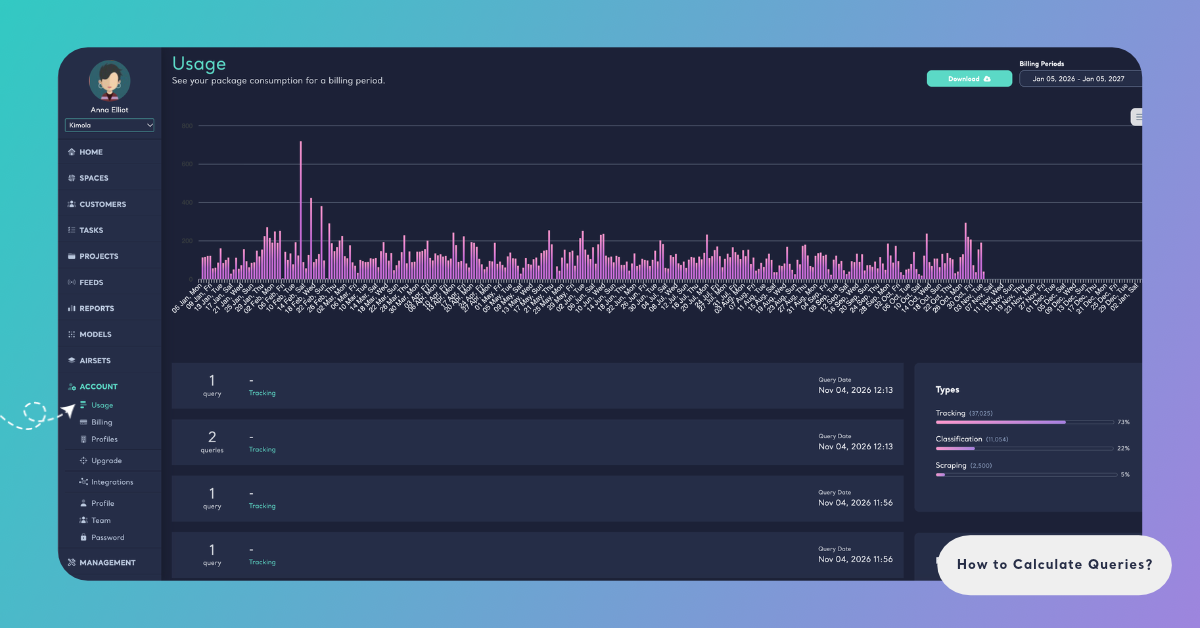
The Usage page under Account shows your package consumption for a billing period. Choose a period under Billing Periods. Types shows your Package, and how much of your Queries, Custom AI Models, Keywords and Links you have used. The Query Date list shows when queries were used, and Download saves the list. See Track Your Usage.
When your queries run low, you can move to a larger package. See Upgrade Your Plan and kimola.com/pricing.