Reports vs. Spaces
min read - Updated on Nov 06, 2026Kimola analyzes customer feedback in two ways. A Report analyzes a single dataset, while a Space lets you track feedback from the same channel over time as you add new files. For example, use a Report to analyze responses from a one-time customer survey. If you run the same survey every month, use a Space to add each month’s responses and see how feedback changes over time.
Reports are available in every package. Spaces are available in the Enterprise package and in Kimola On-Premises.
Two Ways to Analyze Feedback
Reports and Spaces share the same analysis. Both classify every piece of feedback into themes, sentiment and Dimensions, and both have Signals and Action Plans. The difference is the shape of the data and what happens after the first analysis.
A Report starts from one dataset: a file, a set of links, an integration, an Airset or a Feed. You choose the classifiers, the Dimensions and the report language when you create it. Once the Report is ready, its results describe that dataset, and you explore, filter, compare and export them.
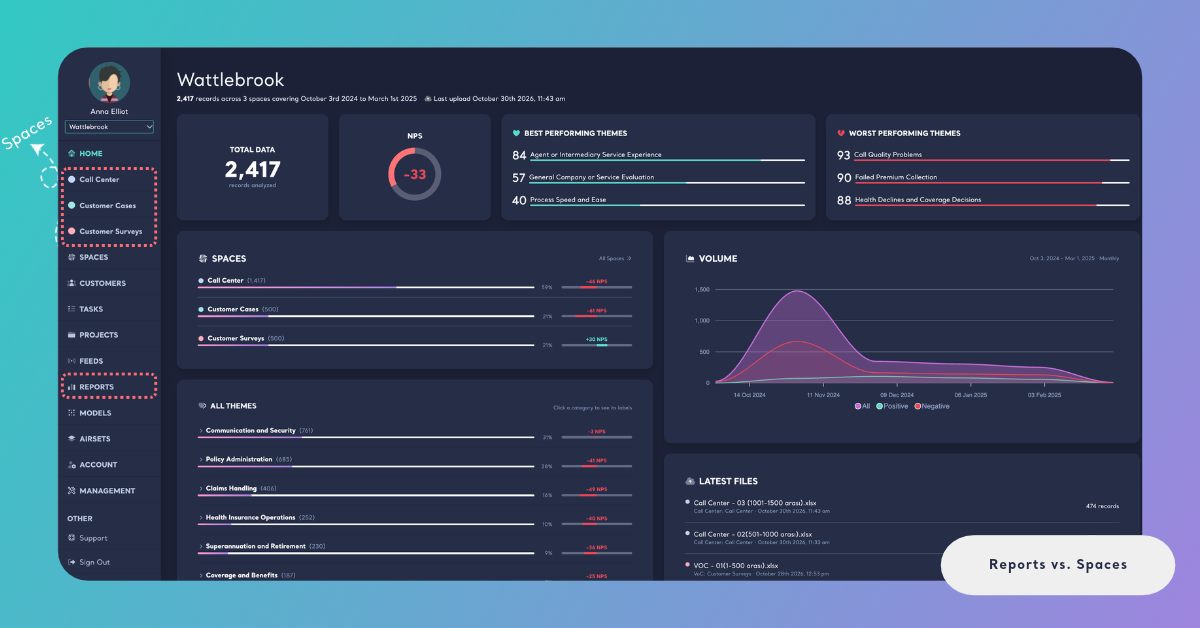
A Space starts empty and is named after a channel, for example Call Center, Social Media or NPS Survey. Its feedback is classified with a Funnel, the set of custom models you choose when you create the Space. Every new file joins the ones before it instead of becoming another report, and after every file Kimola updates the Space's NPS, runs its Signals again and rewrites its Insights where the evidence moved.
When a Report Fits
A Report fits a question you can answer with the data you have today. All of the feedback is there when you create the Report, and the analysis reads it once. Typical cases are a single survey wave, the reviews of your product and its rivals collected from links, a set of support tickets from Zendesk or Intercom, or a one-off study of a product category.
You set up every Report on its own. You pick the classifiers it uses: the Automatic Classifier, which discovers the themes from the data, the Sentiment Classifier, other pretrained models or your custom models. You decide whether a piece of feedback can get one label or several, and which Dimensions to add. This makes a Report the right choice when each study asks different questions, or when you want to try a new classifier or a set of Dimensions on a dataset.
A Report also leaves the analysis open to editing and sharing. On Content you can save filters, change labels and delete records to Junk. You can export a Report to Excel, CSV, PDF or PowerPoint, or send it by email. An Action Plan of a Report can be written for Our own offering, A rival or Our market, so a Report built from a competitor's reviews can turn into actions about that competitor.
Reports are available in every package, including the free Starter package. Starter does not include Feeds or custom models. For packages, see kimola.com/pricing.
When a Space Fits
A Space fits a channel your team keeps feeding and asks the same questions of month after month. A call center that records conversations every day, a survey that keeps collecting answers, or a social media export you download every week each belong in a Space.
The first file sets the Space's schema: a Date Column, one or more named Text Fields that are classified, the other columns you can filter and compare by, and an optional Customer Column. Every later file follows that schema and is classified with the same Funnel as soon as it arrives. A theme in the first file therefore means the same thing as that theme in the latest one, and Spaces that share a Funnel can be read side by side. See Create a Space and Add Files to a Space.
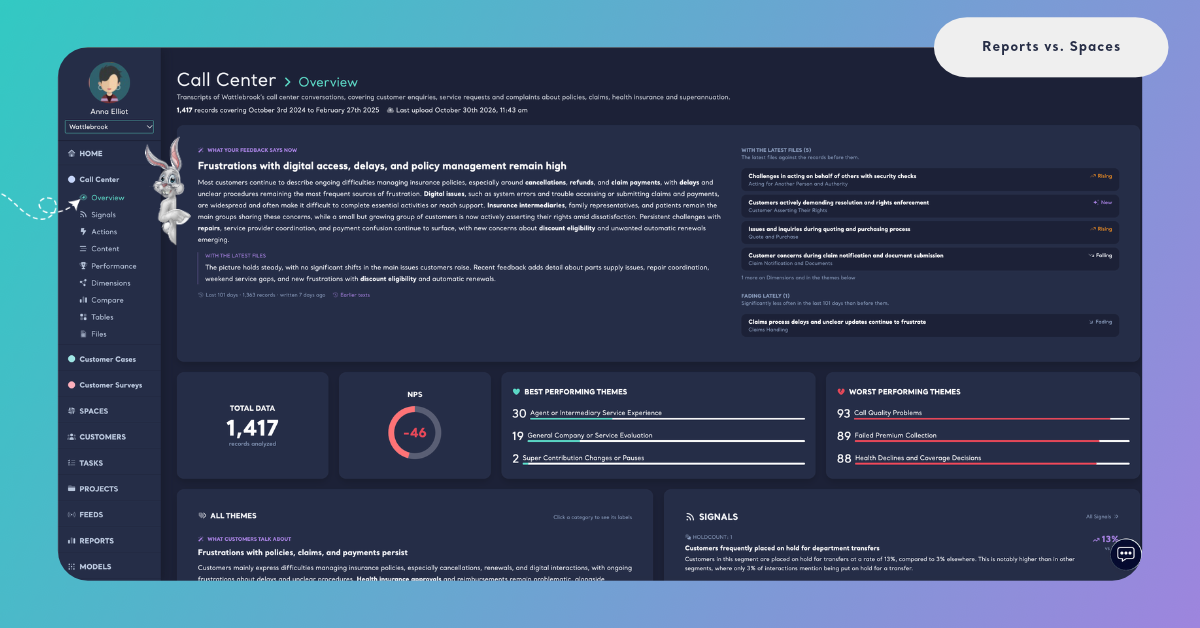
After every classified file, Kimola updates the whole Space. The Space's NPS is calculated again. Its Signals run again over all of its classified feedback, and a file can be one of the groups they compare. Its Insights say what the feedback says now and what the latest files changed, and only the texts whose evidence moved are written again. If a wrong file gets in, you can take it back with its records, and the Space is calculated again without it.
Spaces are also the base of the other features of the Enterprise package. A Customer is recognized by a Space's Customer Column and gets one page with their feedback from every Space. A Department is the part of the feedback one of your teams owns, read across all its Spaces. A Task turns a finding of a Space into work for a teammate, and Kimola later measures whether customers noticed. Once your account has Spaces, Home shows all of them together.
Side-by-Side Comparison
The points below compare a Report and a Space one by one.
Data source. A Report is created from an uploaded file, links to product or business pages, an integration (Zendesk, Intercom or Google Sheets), an Airset or a Feed. A Space is fed with files you upload from one channel.
How data arrives. A Report receives all of its data once, when you create it. A Space receives its data file by file; each file counts in the Space once it is classified, and a file can be taken back with its records.
Models. A Report uses the classifiers and Dimensions you choose for that Report: pretrained models, the Automatic Classifier or your custom models. A Space uses its Funnel: one content classifier, one sentiment classifier and Dimensions, all custom models, shared by every Space that uses the same Funnel.
Time. A Report reads the period its dataset covers; a Date column is optional when you upload a file. A Space requires a Date Column, because the date of every record shows its trends and what changed since the last upload.
NPS. A Report shows sentiment shares, the share of positive and negative feedback, when it has a sentiment classifier; it doesn't calculate NPS. A Space has NPS as its satisfaction metric: the share of positive feedback minus the share of negative feedback, from −100 to 100, shown on every Space and theme. See How NPS Is Calculated in Spaces.
Signals. A Report's Signals are generated for its dataset, and re-generating them replaces the current signals and their verdicts. A Space's Signals run again after every file, and a file can be one of the groups they compare.
Insights. A Report has Dimension analyses, written for its dataset. A Space has Insights, texts Kimola writes after every new file about what its feedback says now and what the latest files changed.
Action Plans. A Report's Action Plan reads the Report and can be written for your own offering, a rival or your market. A Space's Action Plan reads every classified file of the Space, is always about your own offering, and says how many files were classified after it was written.
Customers. Reports don't recognize customers. A Space with a Customer Column ties every piece of feedback to the customer who wrote it, across all your Spaces.
Departments. Reports don't have Departments. Departments are read from Spaces and are set up by the Kimola team together with you.
Tasks. Reports, their Action Plans included, don't make Tasks. In a Space, a Signal, a theme, a piece of feedback, a filtered view, a table, a customer, a Department or an action can become a Task.
Package. Reports are available in every package. Spaces are available in the Enterprise package and in Kimola On-Premises.
The menus of the two follow the same idea. A Report has Overview, Signals, Actions, Dimensions, Content, Performance, Compare, Tables, Junk and Settings. A Space has Overview, Signals, Actions, Content, Performance, Dimensions, Compare, Tables and Files. In a Space, Signals appears once the first Signals exist and Actions once the Space has classified feedback. Files is where the Space's schema and files are kept.
Using Both
Reports and Spaces work side by side in the same account, and many teams use both. A Space follows the channels that keep coming in, while a Report answers the questions that come up once.
A bank can keep its call center conversations and its NPS survey in two Spaces with the same Funnel and read them every week. When a new question comes up, such as how customers talk about a rival's new product, the team creates a Report from that rival's reviews and writes an Action Plan for A rival. When a survey wave is a one-time study rather than a continuing channel, it goes into a Report as well.
A Report can also help build what your Spaces use. A custom model can be created from a Report, and the models of a Funnel are custom models.
Test classifiers and Dimensions on a Report first to decide what your Funnel should hold before your Spaces start classifying with it.