How to Scrape and Analyze Şikayetvar Complaints
6 mins read - Updated on Mar 27, 2026Şikayetvar complaints contain customer feedback about companies, products, and services. Complaints typically describe issues such as delivery problems, billing disputes, product defects, or dissatisfaction with customer support.
Analyzing complaint data helps identify recurring issues and patterns in customer dissatisfaction.
Kimola allows you to automatically collect and analyze Şikayetvar complaints without requiring any technical setup.
Create a free account or sign in to your existing Kimola account.
Şikayetvar complaints can be collected automatically by adding a Şikayetvar complaint page link to Kimola. This tutorial explains how to collect complaints using a page link and how to analyze the collected data within the platform.
Automatically Scrape Şikayetvar Complaints
Automatic scraping allows you to analyze Şikayetvar complaints simply by providing the link of a complaint listing page. There is no need to manually collect complaints or prepare a dataset beforehand.
When a Şikayetvar link is added, Kimola automatically detects the platform, collects publicly available complaints, and prepares the dataset in the background. The collected data is then processed through Kimola’s report creation workflow according to the analysis settings you choose.
This method is useful when analyzing complaints about a specific brand or when comparing complaint patterns across multiple companies.
Follow the steps below to create your report.
Step 1: Get the Şikayetvar Page Link
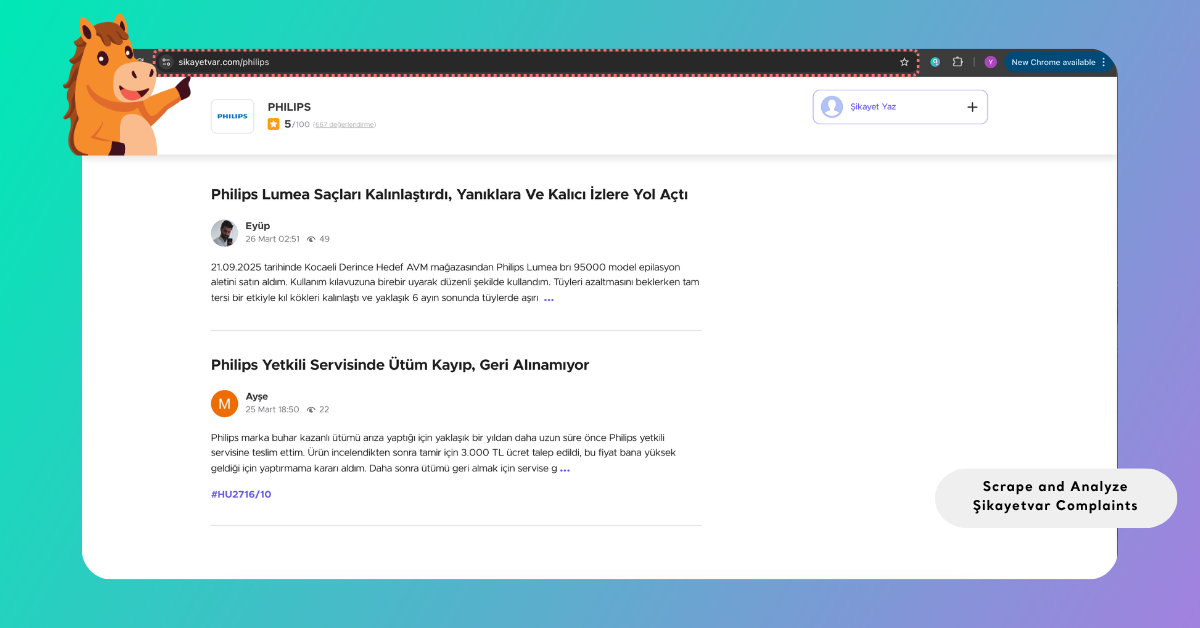
Open Şikayetvar.com and navigate to the brand page you want to analyze.
Locate the page that lists customer complaints related to the brand and copy the URL from the browser’s address bar.
The link should point to a complaint listing page rather than an individual complaint page.
The URL generally follows a structure similar to: https://www.sikayetvar.com/...
You can analyze complaints from a single brand page or include multiple brand pages to compare complaint patterns across companies.
To view all platforms that support auto-scraping, refer to Supported Platforms for Creating Reports from Links, which includes platform-specific details.
Step 2: Enter the Link into Kimola
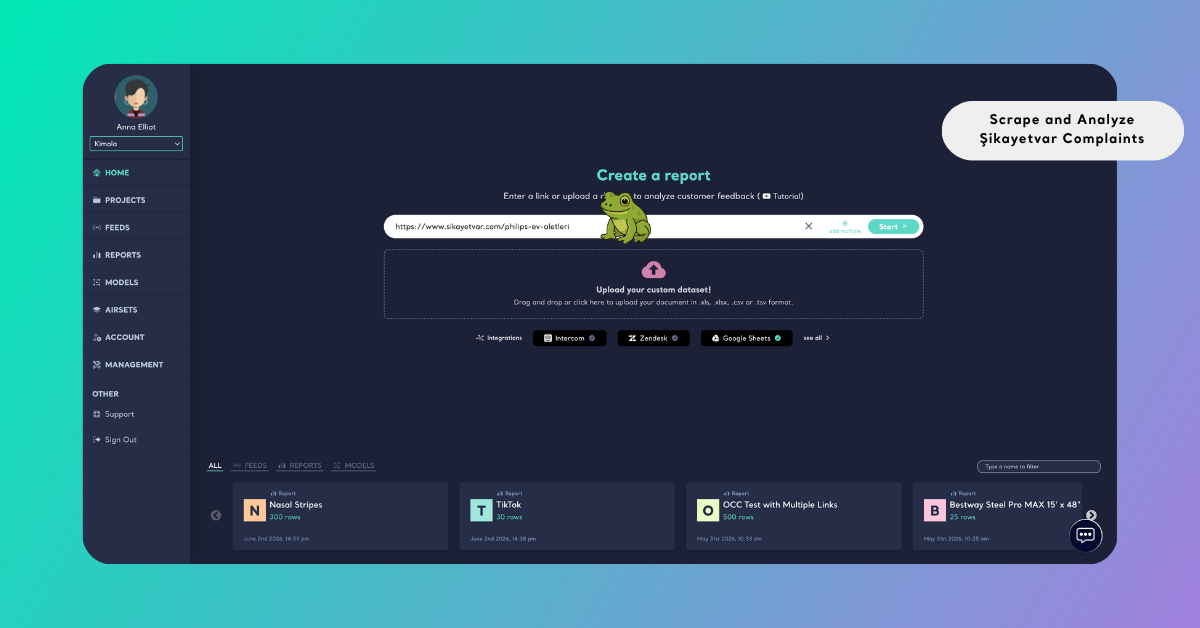
Open the Kimola Dashboard and locate the Create your report section on the home screen.
Paste the Şikayetvar page link you copied in the previous step into the input field and select Start to continue.
If you want to analyze complaints from multiple brands, you can include more than one Şikayetvar link. This allows you to compare complaint patterns across companies or evaluate customer feedback for different competitors.
To include multiple sources, select Add Multiple and enter each Şikayetvar link on a separate line.
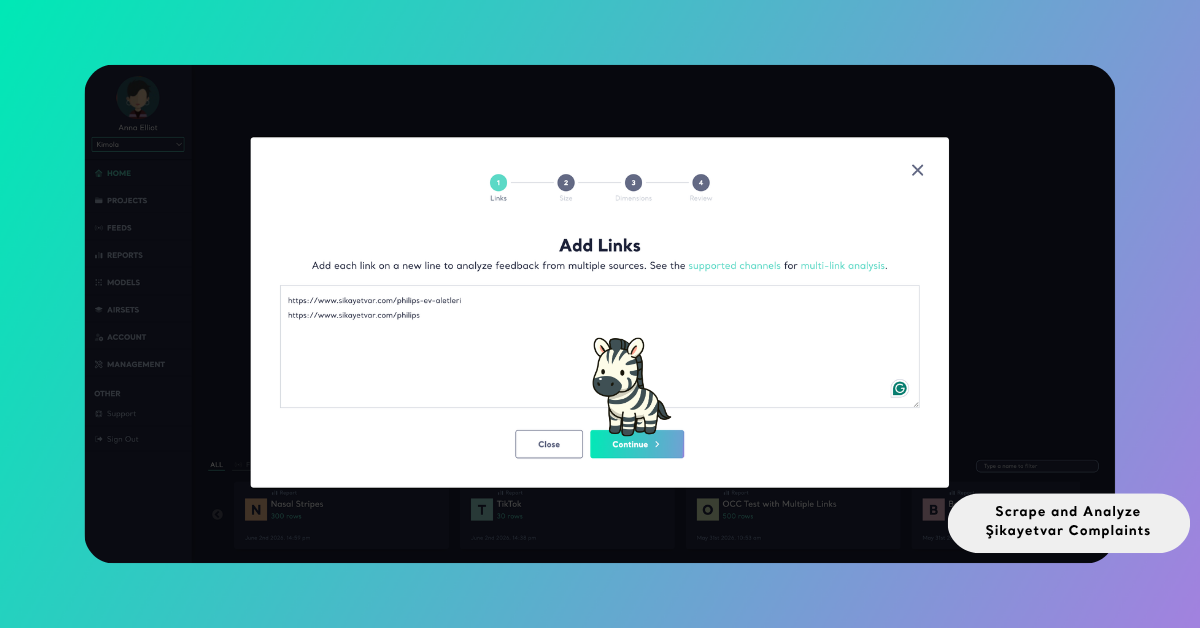
After the links are submitted, Kimola automatically validates each URL to ensure that the pages are supported and accessible. If any issues are detected, a validation screen highlights the problematic links so they can be corrected or removed before continuing.
Once validation is complete, Kimola collects the available complaints from the selected pages and prepares the dataset for analysis.
Step 3: Select the Report Size
Kimola then prompts you to define how many complaints will be collected and analyzed. Using the slider, you can select the dataset size that will be used to generate the report.
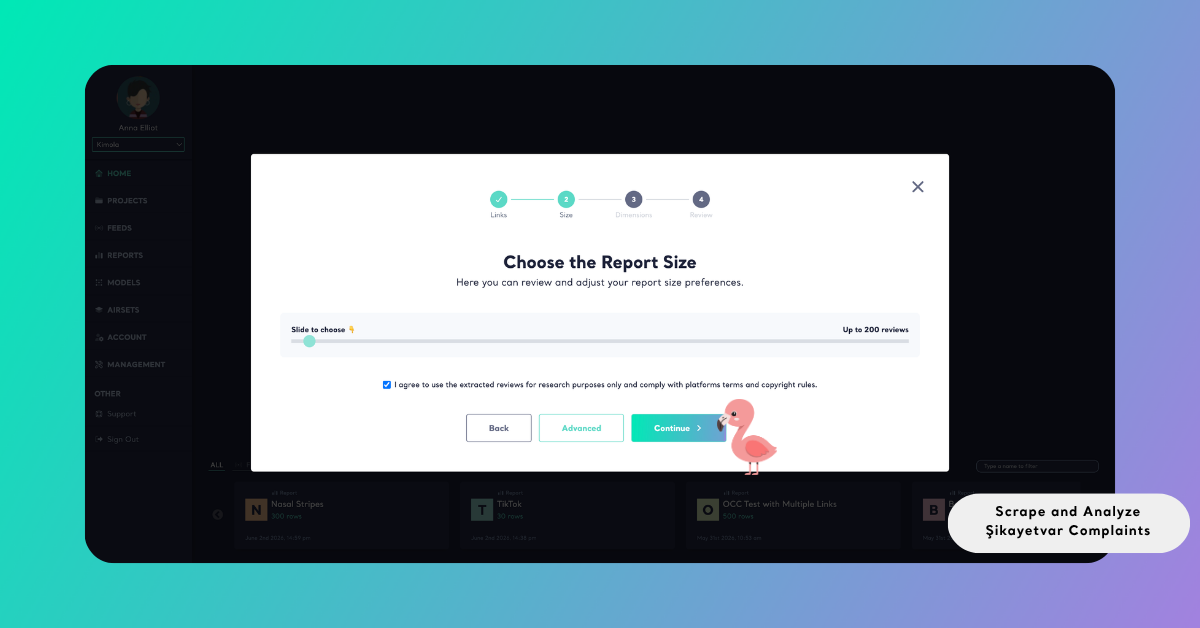
The number of complaints that can be collected depends on how many publicly available complaints exist on the selected Şikayetvar page.
When multiple links are included, Kimola distributes the selected dataset size across all sources. If one page contains fewer complaints than required, the remaining portion is automatically filled using complaints from the other pages.
This ensures that the dataset reaches the selected size whenever sufficient data is available while also helping you manage query usage efficiently.
Understanding Şikayetvar Complaint Data
Şikayetvar complaints typically contain detailed descriptions of negative customer experiences. Users often explain the problem they encountered, the steps they took to resolve it, and their expectations from the company.
These complaints frequently mention issues such as delayed deliveries, billing problems, customer support dissatisfaction, product defects, or unresolved service requests.
When Şikayetvar complaints are collected automatically, Kimola captures the main fields available on the platform, including complaint text, date, source URL, and complaint title information. These fields can later be used to filter the dataset, analyze sentiment patterns, or identify recurring complaint themes.
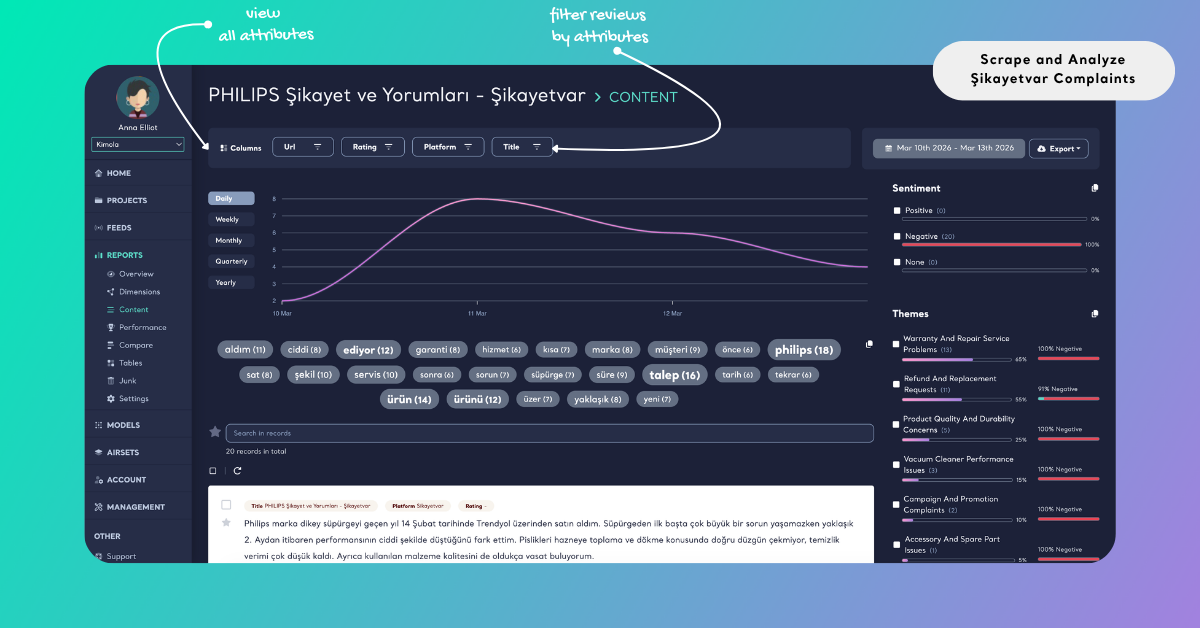
Analyze Şikayetvar Complaints
Once the complaints are collected, they can be analyzed to identify recurring issues, sentiment patterns, and common customer frustrations.
Kimola converts complaint data into structured insights that help teams understand the main drivers of dissatisfaction and detect patterns in customer complaints.
In addition to one-time analysis, you can automatically monitor complaint data by creating a Feed, which generates regular reports and alerts.
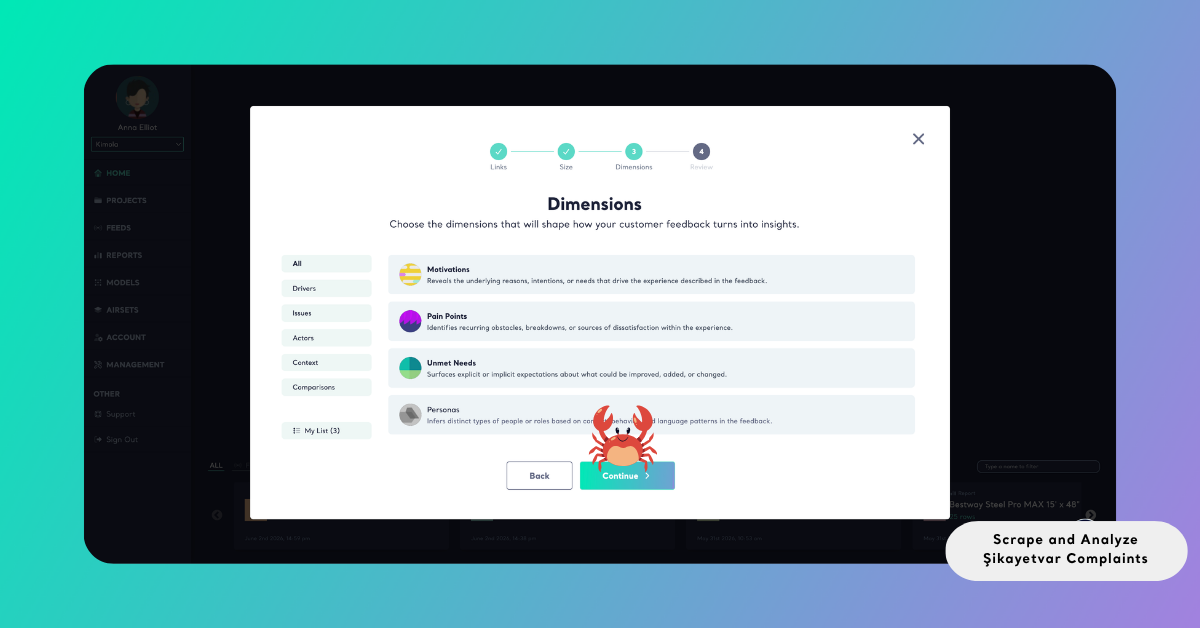
Choose Dimensions
In addition to sentiment analysis and standard classifications, Kimola allows you to apply dimension layers to complaint data. These dimensions help reveal broader patterns such as common service failures, recurring complaint topics, and factors influencing customer dissatisfaction.
Selected dimensions appear under My List, where they can be reviewed and adjusted before the report is created.
Review Report Settings
Before the analysis begins, Kimola presents the Review screen, where the report configuration can be reviewed and finalized.
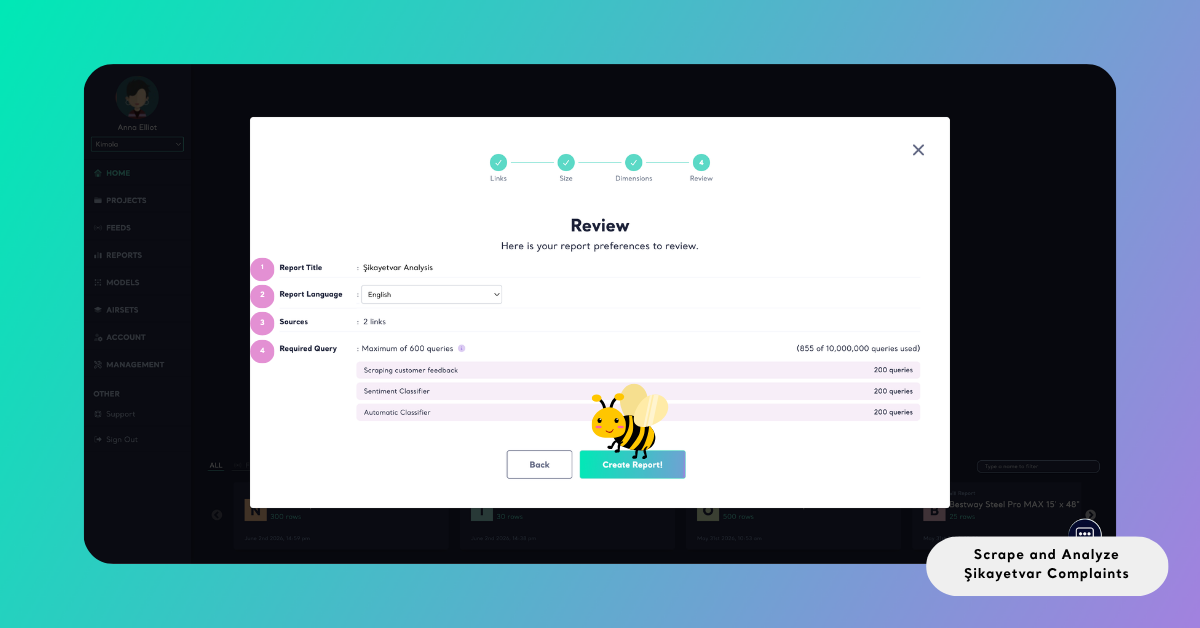
At this stage, the Report Title is either generated automatically based on the selected Şikayetvar source or entered manually if multiple links are included. The Source / Dataset field displays the origin of the data used in the report, while the Report Output setting determines the language of the analysis results, including sentiment labels, themes, and summaries.
The Required Query section provides a breakdown of the total queries needed to complete the report, covering both data collection and analysis steps. This helps you understand how the selected dataset size and analysis options impact your query usage before running the report.
Create the Report
Select Create Report to start the process. Kimola collects the selected complaint data, applies the configured analyses, and generates the report automatically.
Once the report is ready, it appears in the Reports section of the dashboard. From there, you can review the analysis results, organize the report under a Project, or export the outputs for further use.
Reports can be exported in formats such as Excel, PowerPoint, and PDF, and can also be shared via email for scheduled or on-demand distribution.
Conclusion
Customer complaints on Şikayetvar provide valuable insight into the challenges customers encounter when interacting with companies and services. Analyzing these complaints helps organizations identify operational issues, understand customer dissatisfaction, and monitor recurring problem areas.
Kimola simplifies this process by automatically collecting publicly available complaint data and preparing it for structured analysis.
All complaint data should be collected and analyzed strictly for research and internal evaluation purposes. Complaint content must not be redistributed or republished in ways that violate platform policies or applicable copyright regulations. Users are responsible for complying with all relevant terms.
- How to Scrape and Analyze Hepsiburada Reviews
- How to Scrape and Analyze Ekşi Sözlük Entries
- Creating a Consumer Research Report for the LED Face Mask Category
- Creating a Consumer Research Report for the Automatic Pet Feeder Category
- Creating a Consumer Research Report for the Portable Juice Blender Category