Creating a Consumer Research Report for the Automatic Pet Feeder Category
14 mins read - Created on Jul 02, 2026Automatic pet feeders have become a popular solution for pet owners looking to simplify daily feeding routines while ensuring their pets receive meals consistently. As the category continues to grow, so do the questions surrounding it. What drives consumers to purchase an automatic pet feeder? Which product features matter most? What challenges shape the ownership experience? And where are the biggest opportunities for improvement?
In this tutorial, you'll learn how to answer questions like these by building a complete consumer research report in Kimola. To make the process practical, we'll work with a sample dataset created for Petsense, a fictional automatic pet feeder brand, and use it to explore the category from multiple perspectives.
As you follow along, you'll learn a repeatable workflow for preparing data, understanding your report, interpreting individual analyses, and connecting insights to answer real business questions.
Before we begin, download the sample dataset and upload it to your Kimola workspace. We'll use the same dataset throughout this tutorial as we build our research report step by step.
If you don't already have a Kimola account, sign up first, then sign in and navigate to the Dashboard Home page.
Understanding Your Dataset
Customer feedback becomes much more valuable when it's organized into a structured dataset. Before exploring the analyses, let's take a closer look at the data we'll use throughout this tutorial.
Our sample dataset contains 1,714 e-commerce reviews collected across Petsense and several competing automatic pet feeder brands. Although fictional, it reflects the kind of customer feedback organizations commonly collect from e-commerce platforms, customer surveys, support channels, and online communities.
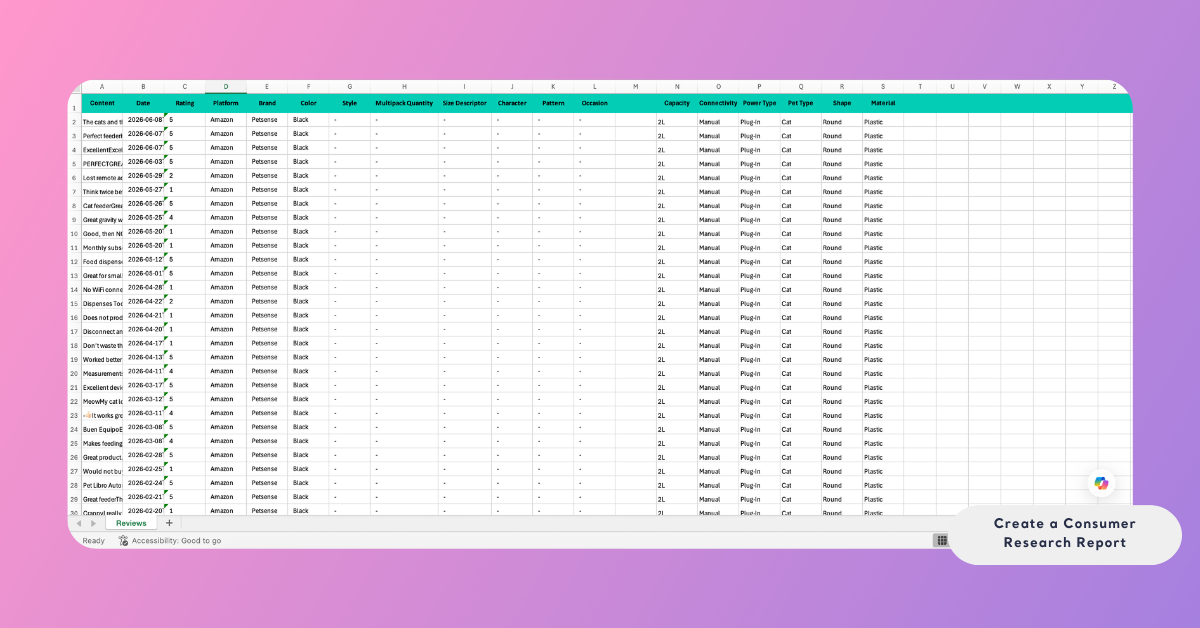
The Content column contains the customer reviews that Kimola analyzes to identify recurring patterns, behaviors, and consumer insights.
Alongside the reviews, the dataset includes structured columns such as Brand, Platform, Connectivity, Capacity, Pet Type, Power Type, Material, and Rating. These attributes provide valuable context for every conversation, making it possible to compare products, explore different customer groups, and understand how experiences vary across product features.
Think about the questions you may want to answer before building your dataset. Including relevant product attributes from the beginning makes it easier to compare results, uncover patterns, and answer more specific business questions later in your analysis.
Creating Your Report
With your dataset ready, the next step is to create a report in Kimola.
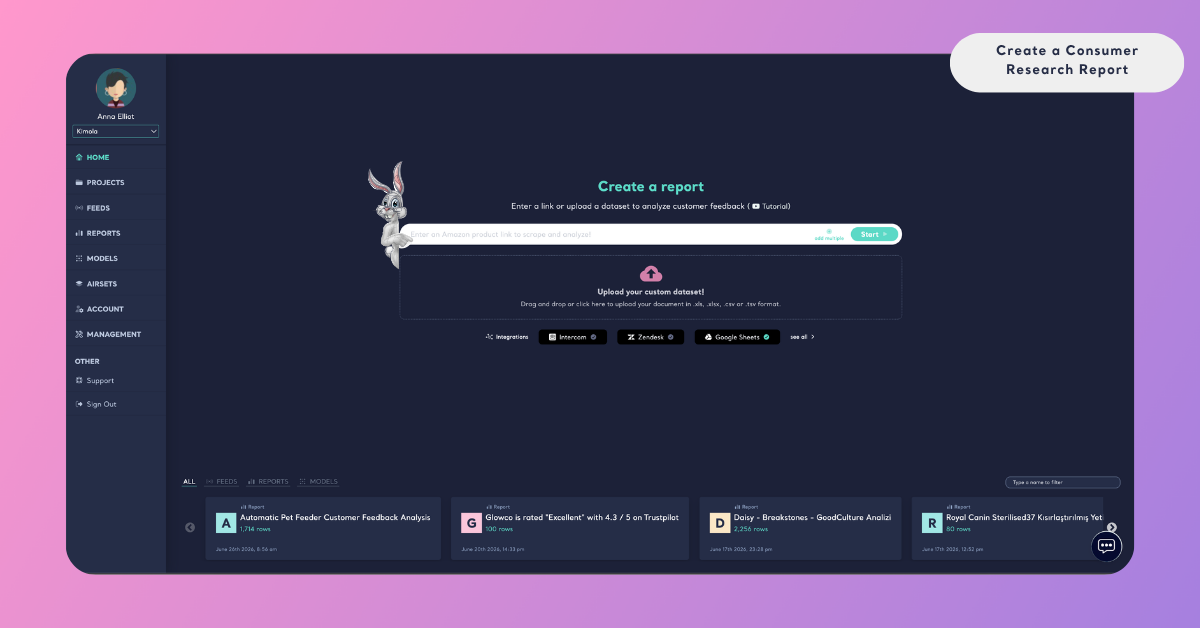
From the Dashboard Home page, upload the sample dataset using the Upload your custom dataset section. Kimola will then guide you through a short setup process before generating your report.
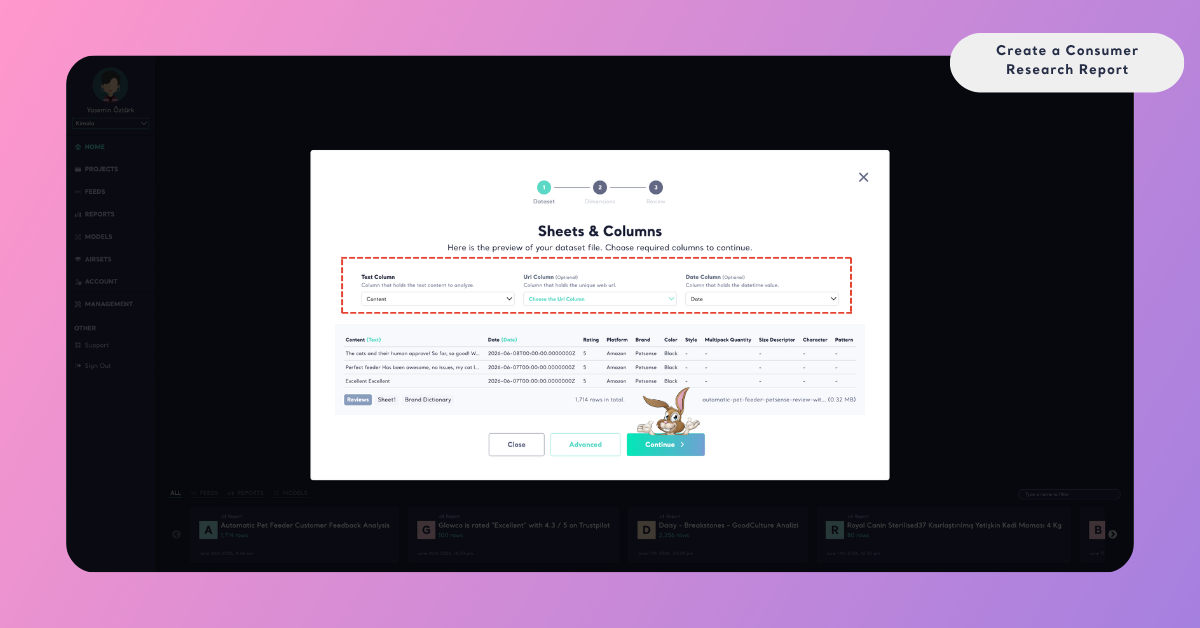
Start by reviewing your dataset and mapping the required columns. Assign the Content column as the Text Column so Kimola knows which field contains the customer feedback to analyze. If your dataset includes additional fields such as dates or URLs, you can map those as well.
Next, select the dimensions you want to include in your report. Each dimension examines customer feedback from a different analytical perspective, allowing you to answer different types of consumer research questions.
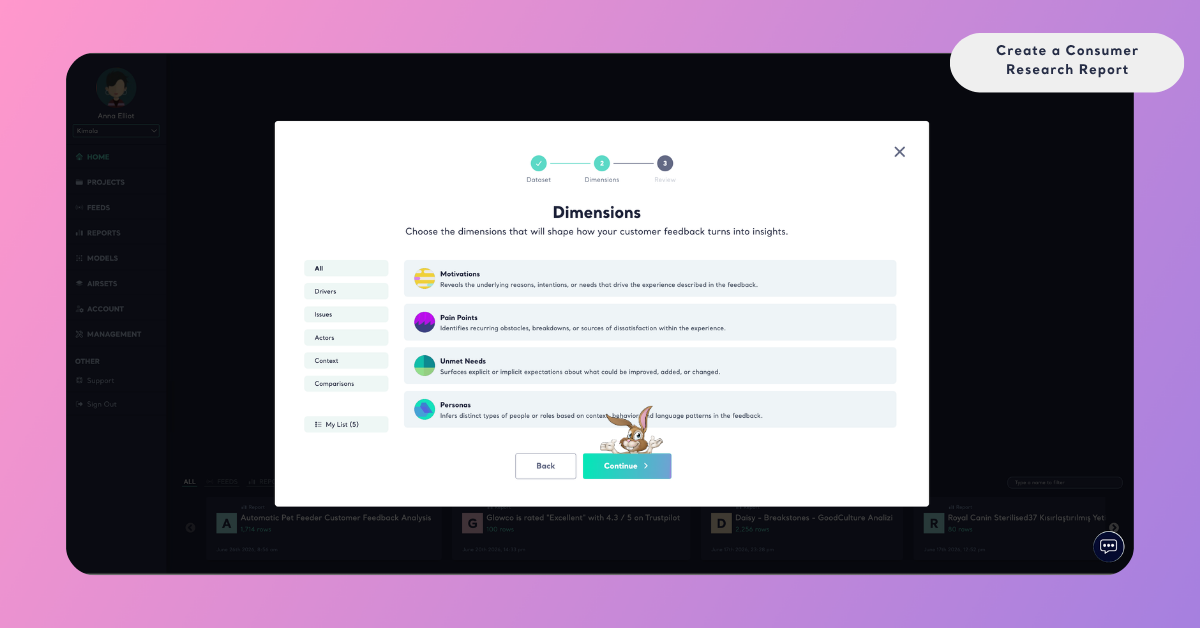
You don't need to select every dimension at the beginning. As your research evolves, you can add additional dimensions later without creating a new report.
Finally, review your report settings, give your report a name, choose the report language, and click Create Report to start the analysis.
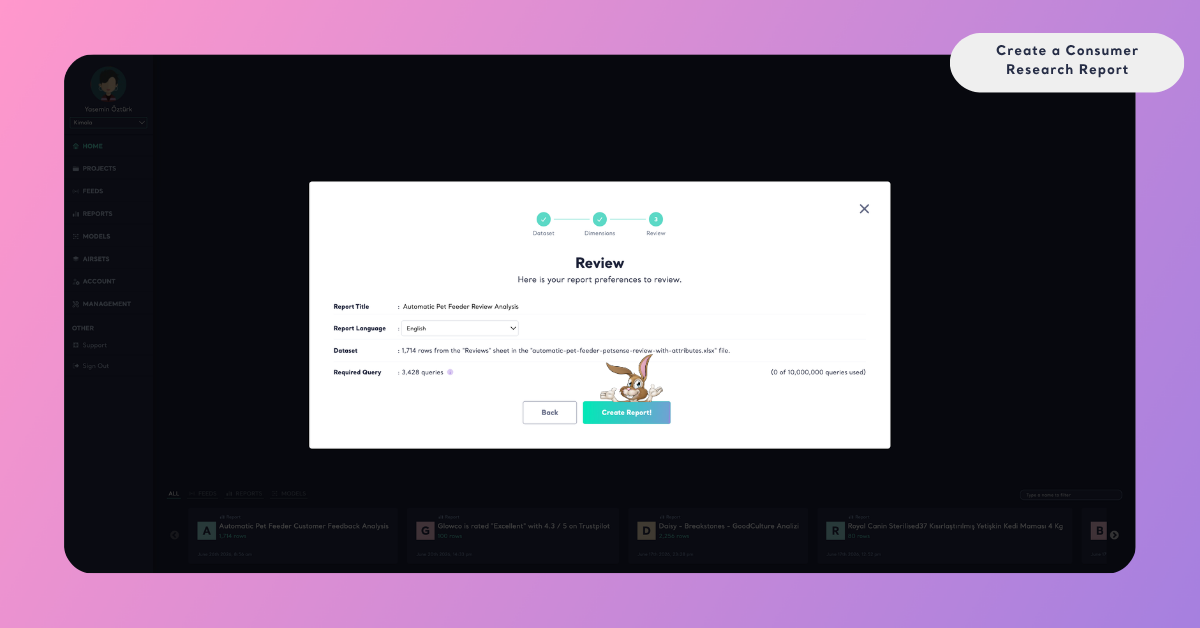
Kimola will process your dataset and generate the selected analyses automatically. Once processing is complete, your report is ready to explore.
A First Look at Your Report
By now, Kimola has transformed thousands of customer reviews into a structured research report. Rather than reading individual reviews one by one, you can now explore recurring patterns, compare different customer experiences, and investigate the questions that matter most for your research.
The Overview page acts as a starting point for that exploration. Instead of presenting a single visualization, it brings together the most important findings generated across your report—from high-level summaries and automatically generated Signals to theme previews, executive summaries, conversation trends, and the original customer feedback.
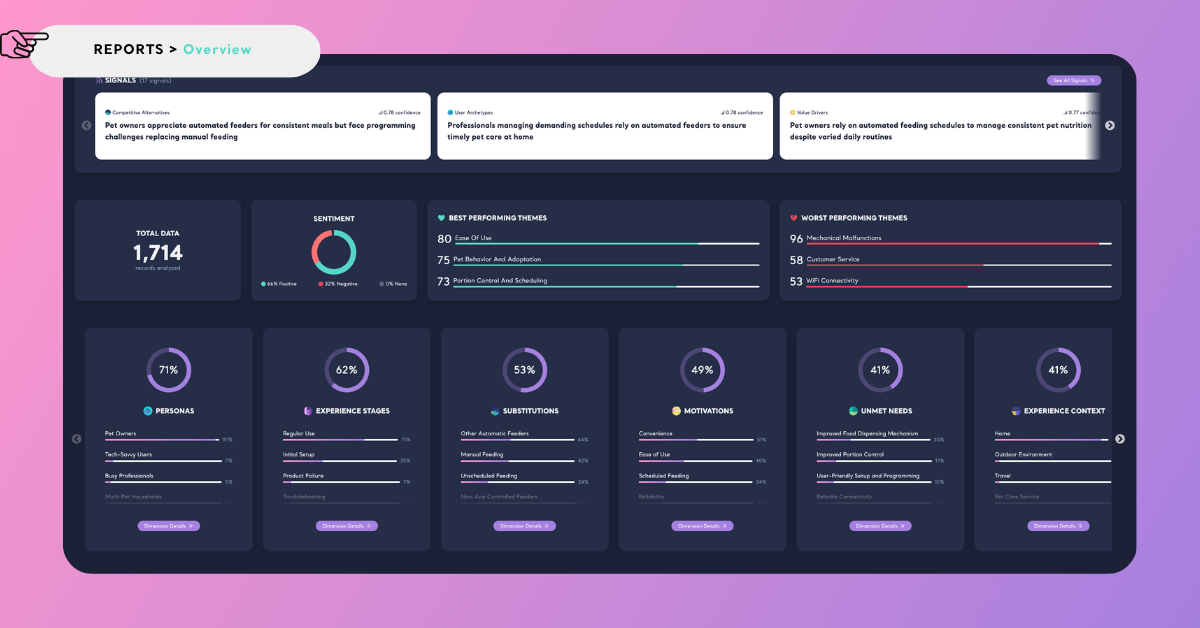
With so much information available, it's tempting to start opening analyses one after another. In practice, however, consumer research works best when each analysis is used to answer a specific question rather than explored in isolation.
In this tutorial, we'll use the report to answer questions such as:
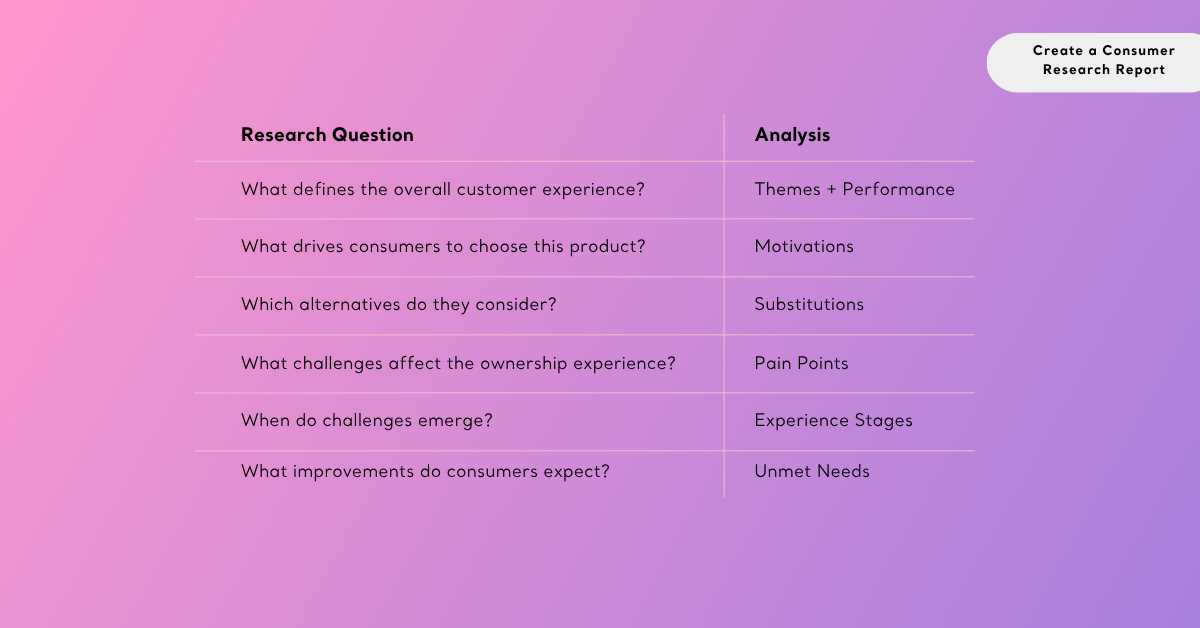
The Overview provides a useful starting point, but it doesn't tell the whole story. Before exploring these analyses individually, we'll begin with Signals, which connect findings across the report to reveal the broader patterns shaping the automatic pet feeder experience.
Discovering Patterns with Signals
Individual analyses explain different aspects of the customer experience, but they don't always reveal how those findings relate to one another. Signals automatically identify meaningful relationships across your report, helping uncover recurring patterns that emerge when multiple analyses point in the same direction.
Signals are generated automatically when your report includes enough analyses to identify meaningful relationships. If too few dimensions are selected, Signals won't be available.
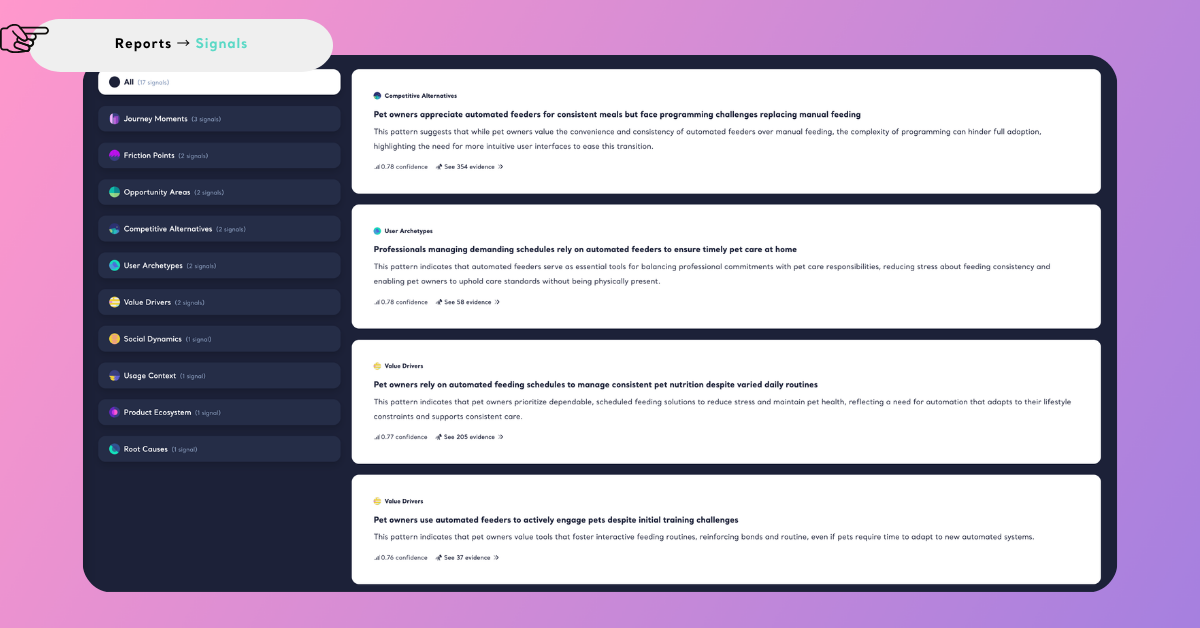
In the automatic pet feeder category, these patterns tell a remarkably consistent story. Pet owners are primarily drawn to automatic feeders because they simplify daily feeding routines, support consistent meal schedules, and provide peace of mind when they're away from home. Signals repeatedly connect these motivations with user groups such as busy professionals and with everyday home use, reinforcing convenience as one of the category's strongest value drivers.
At the same time, many Signals reveal that convenience alone does not guarantee a positive experience. Initial setup, programming, and ongoing reliability appear throughout the report as recurring friction points. Mechanical failures, inconsistent portion dispensing, Wi-Fi connectivity issues, and confusing controls repeatedly emerge as factors that interrupt the dependable experience consumers expect from an automated product.
Signals also highlight where the greatest opportunities for improvement. Simplifying setup and programming, improving portion accuracy, strengthening product reliability, and making the overall experience more intuitive all appear as recurring opportunities across multiple analyses. Rather than representing isolated issues, these findings consistently reinforce one another throughout the report.
Together, these patterns suggest that the success of an automatic pet feeder depends not simply on automating meals, but on delivering automation that consumers can trust every day. In the following sections, we'll explore the individual analyses behind these Signals to understand the motivations, challenges, and opportunities shaping the category.
What Shapes the Automatic Pet Feeder Experience
Customer conversations about automatic pet feeders extend far beyond simply dispensing food. Owners evaluate these products as part of their daily routines, considering not only whether meals are delivered on time, but also how easy the feeders are to use, how well their pets adapt to them, and whether they can be trusted to perform consistently.
The Themes analysis organizes these conversations into recurring topics, revealing the aspects of the ownership experience that receive the greatest attention from consumers.
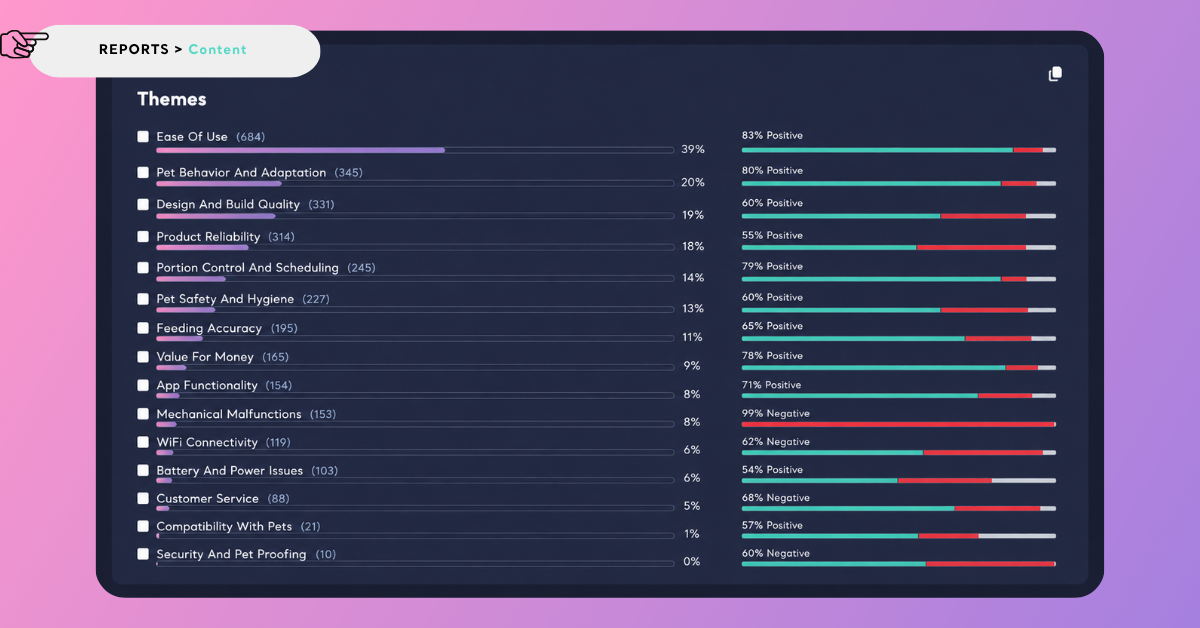
In our example report, Ease of Use dominates customer conversations, accounting for 39% of all theme-related discussions. Owners frequently praise straightforward setup, intuitive scheduling, and features that simplify daily feeding routines, confirming that convenience is one of the category's defining expectations. However, ease of use is only one part of the overall experience.
Other major themes include Pet Behavior & Adaptation (20%), Design & Build Quality (19%), and Product Reliability (18%). These findings show that consumers evaluate automatic pet feeders not only by how easy they are to operate, but also by how naturally they fit into their pets' routines, how well they are built, and whether they can be relied on over time.
While Themes reveal what consumers discuss most frequently, they don't necessarily indicate which aspects of the experience deserve the greatest attention. That's where the Performance dashboard provides additional context.
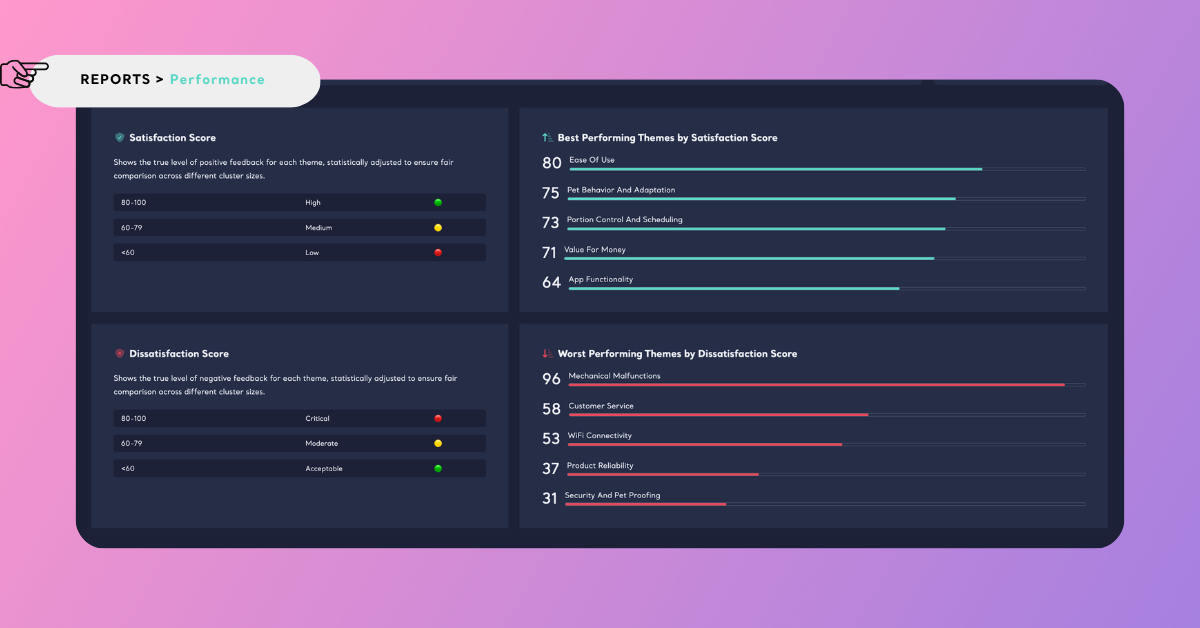
Performance evaluates each theme by considering both its prominence in customer conversations and the overall customer sentiment associated with it. This helps distinguish category strengths from areas that require improvement.
In this dataset, Ease of Use stands out as one of the category's strongest-performing themes, combining high conversation volume with consistently positive customer feedback. Portion Control & Scheduling and Pet Behavior & Adaptation also perform well, suggesting that automatic pet feeders generally succeed in delivering their core promise of making feeding routines more convenient and consistent. In contrast, Mechanical Malfunctions emerges as the category's most critical weakness, while Customer Service, WiFi Connectivity, and Product Reliability continue to generate substantial dissatisfaction. These findings suggest that long-term customer satisfaction depends not only on smart features and convenience, but also on dependable hardware and reliable day-to-day performance.
Together, Themes and Performance provide a strong foundation for understanding the category. They reveal what consumers care about most and highlight the aspects of the ownership experience that deserve closer attention. Understanding what consumers talk about is only the beginning. The next question is why they choose automatic pet feeders in the first place.
Why Do Pet Owners Adopt Automatic Feeders
Choosing an automatic pet feeder isn't simply about automating mealtimes. For many owners, these products provide reassurance that their pets will be fed consistently, even when work, travel, or other responsibilities keep them away from home.
The Motivations analysis identifies the goals, needs, and situations that drive purchasing decisions.
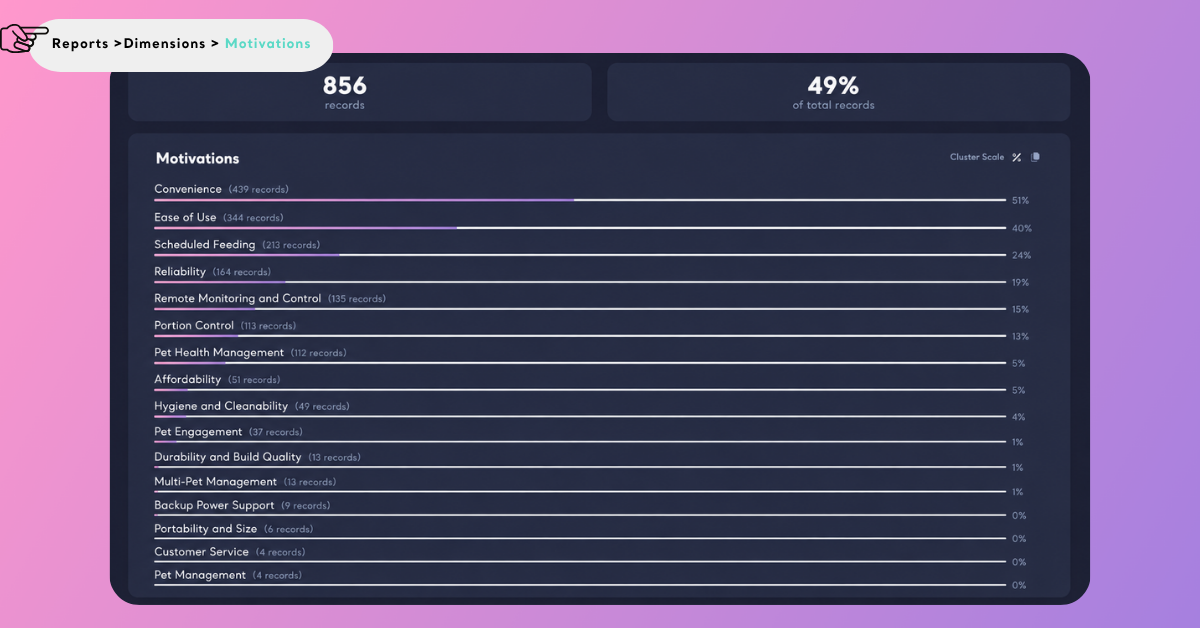
Convenience emerges as the strongest motivation, followed by Ease of Use and Scheduled Feeding. Together, these findings show that owners primarily value products that simplify daily routines while helping them maintain consistent feeding schedules.
Other motivations, such as Reliability and Remote Monitoring & Control, reveal that convenience alone isn't enough. Owners also want confidence that the feeder will continue working reliably, especially when they are away from home.
These motivations explain why consumers enter the category. The next step is understanding what alternatives they consider before deciding that an automatic pet feeder is the right solution.
What Alternatives Do Pet Owners Consider
Consumers don't always decide between competing brands. In many cases, they first decide whether they need an automatic pet feeder at all.
The Substitutions analysis identifies the products, services, and behaviors consumers consider as alternatives when discussing a category. Understanding these alternatives helps explain what need the product is replacing—not just which competitors it is competing against.
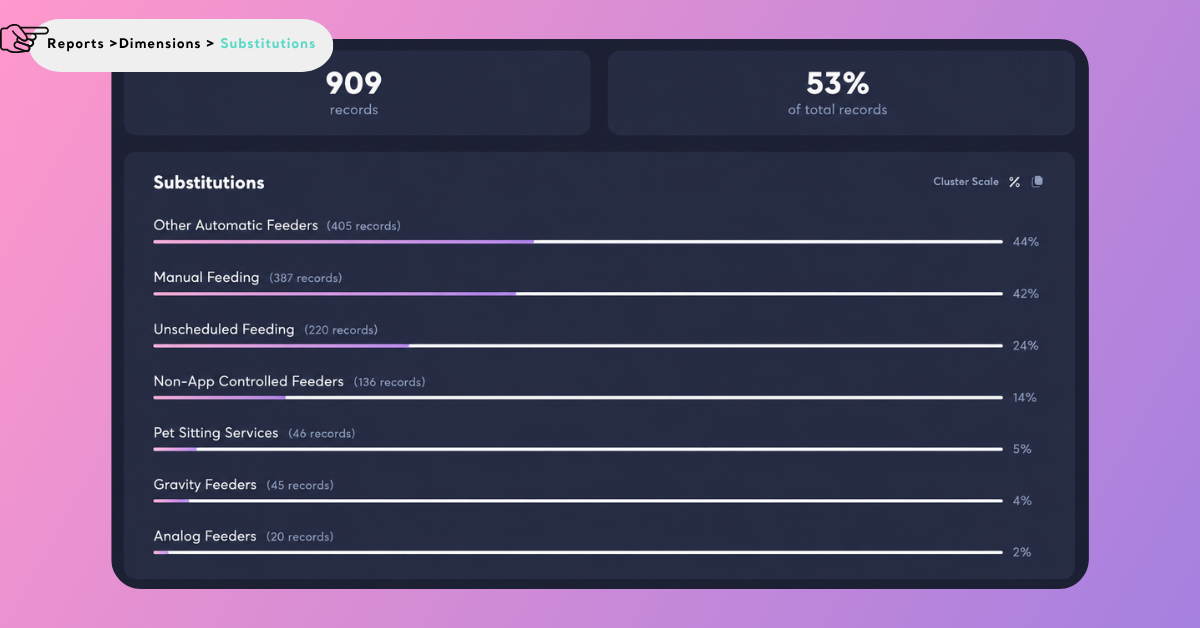
In our example report, automatic pet feeders are most often compared with manual feeding, other automatic feeders, and unscheduled feeding routines. Less frequently, consumers mention alternatives such as non-app-controlled feeders, pet sitting services, gravity feeders, and analog feeders.
These comparisons reveal that automatic pet feeders are primarily adopted to replace manual routines and provide greater consistency when owners are away from home. Consumers value features such as programmable schedules, portion control, and remote monitoring, but they also compare these benefits against simpler alternatives that require less setup and fewer technical dependencies.
Viewed together, these conversations show that the category competes with both traditional feeding habits and lower-maintenance solutions. While automation offers greater control and convenience, consumers continue to weigh those benefits against concerns such as programming complexity, connectivity issues, and long-term reliability.
The next step is understanding the challenges that prevent automatic pet feeders from consistently meeting those expectations.
Where Do Automatic Pet Feeders Fall Short
Automatic pet feeders are designed to make feeding more convenient, but customer conversations show that convenience alone doesn't define the ownership experience. Long-term satisfaction depends on whether the product continues to perform reliably day after day.
The Pain Points analysis highlights the recurring obstacles that prevent products from meeting those expectations.
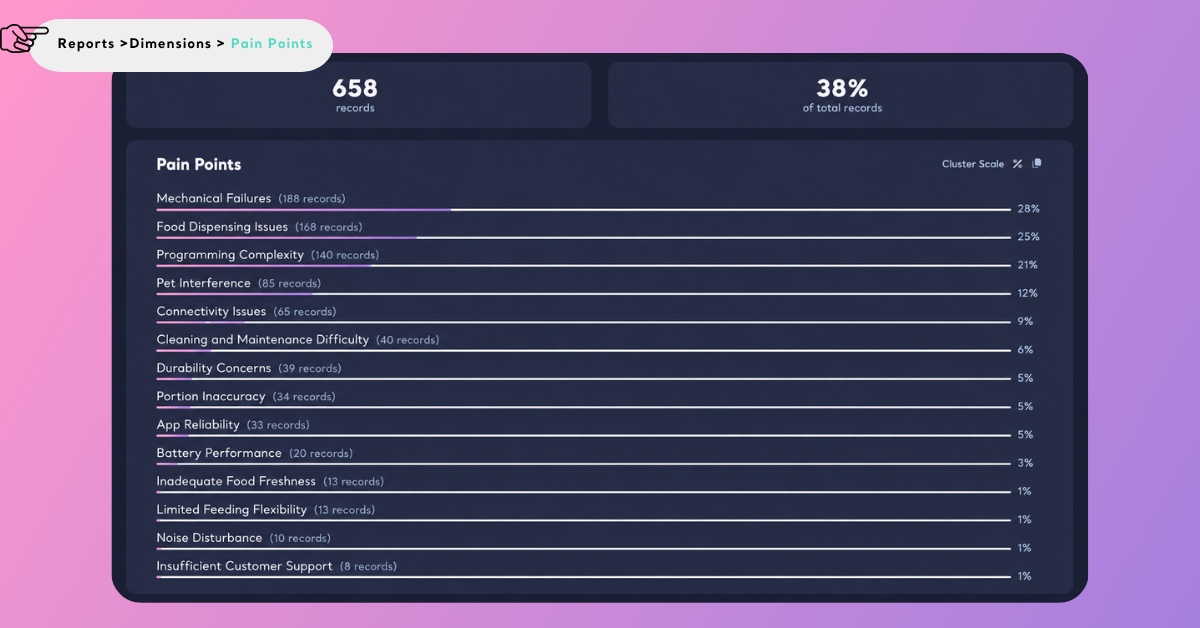
Based on the findings, the most common frustrations centre on Mechanical Failures, Food Dispensing Issues, and Programming Complexity. Although these problems appear very different on the surface, they all point to the same underlying expectation: pet owners need a feeder they can trust to work consistently with minimal effort.
Understanding what customers struggle with is only part of the story. To understand when those challenges emerge, we can combine Pain Points with Experience Stages using the Tables.
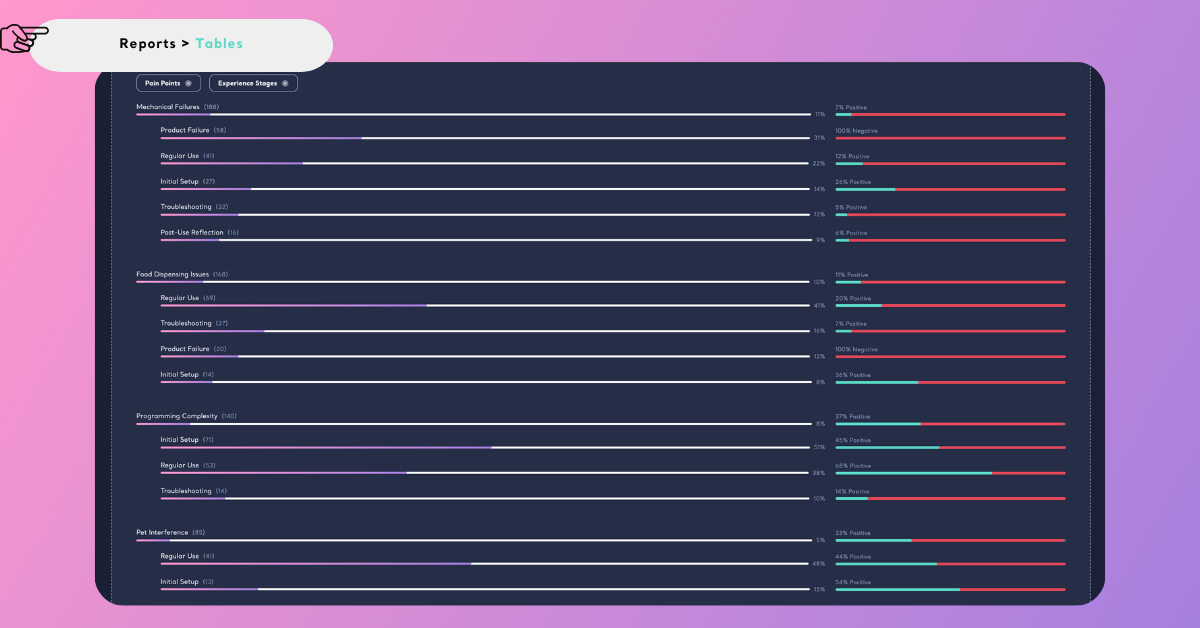
This reveals that different challenges emerge at different moments in the ownership journey. Programming Complexity is concentrated during Initial Setup, when owners are configuring schedules and learning how the product works. Once the feeder becomes part of everyday routines, Food Dispensing Issues and Pet Interference become much more common during Regular Use. Meanwhile, Mechanical Failures, Connectivity Issues, and App Reliability frequently appear during Troubleshooting and Product Failure, where technical issues begin to undermine confidence in the product.
Looking at these dimensions together transforms a simple list of customer complaints into a timeline of the ownership experience. Instead of seeing isolated problems, businesses can identify where the journey begins to break down and prioritize improvements at the stages where they will have the greatest impact.
How Could Automatic Pet Feeders Be Improved
Customer feedback doesn't only highlight existing problems—it also reveals how consumers believe products could better meet their expectations.
The Unmet Needs analysis identifies the improvements, features, and capabilities customers continue to ask for, helping businesses uncover opportunities for innovation beyond today's customer experience.
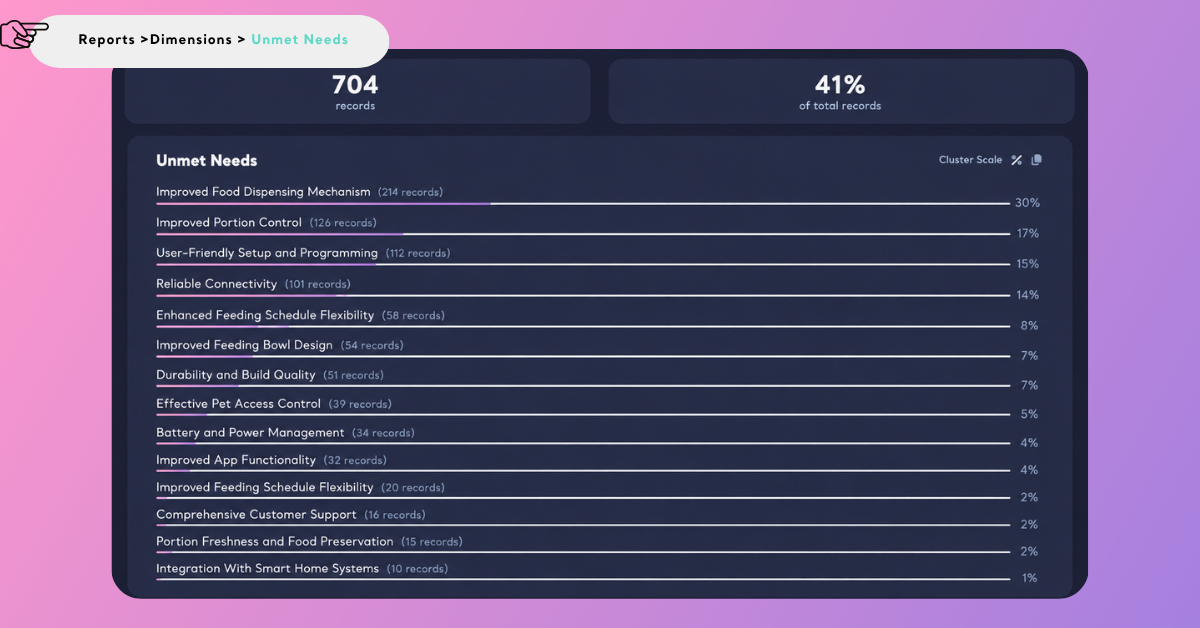
The findings show that many requested improvements build directly on the challenges explored earlier. Improved Food Dispensing Mechanisms and Improved Portion Control emerge as the most frequently discussed unmet needs, reinforcing the importance of delivering meals accurately and consistently. Customers also express a strong desire for User-Friendly Setup and Programming and Reliable Connectivity, suggesting that ease of use extends beyond day-to-day operation to include the entire setup and ownership experience.
Rather than requesting entirely new capabilities, many consumers are asking for products that execute the fundamentals more reliably. More dependable dispensing, clearer programming, flexible scheduling, and robust connectivity would address many of the frustrations already identified throughout the customer journey.
Taken together, these findings help shift the conversation from identifying problems to prioritizing product improvements, providing a clearer roadmap for future product development and innovation.
Where Do Automatic Pet Feeders Differ
So far, we've explored the category as a whole. However, consumer research often goes a step further by asking how customer experiences differ across product variations rather than across the category alone.
The Compare feature allows you to examine any analysis across structured attributes such as Capacity, Power Type, Connectivity, Pet Type, or Shape, making it possible to identify which product characteristics influence different aspects of the customer experience.
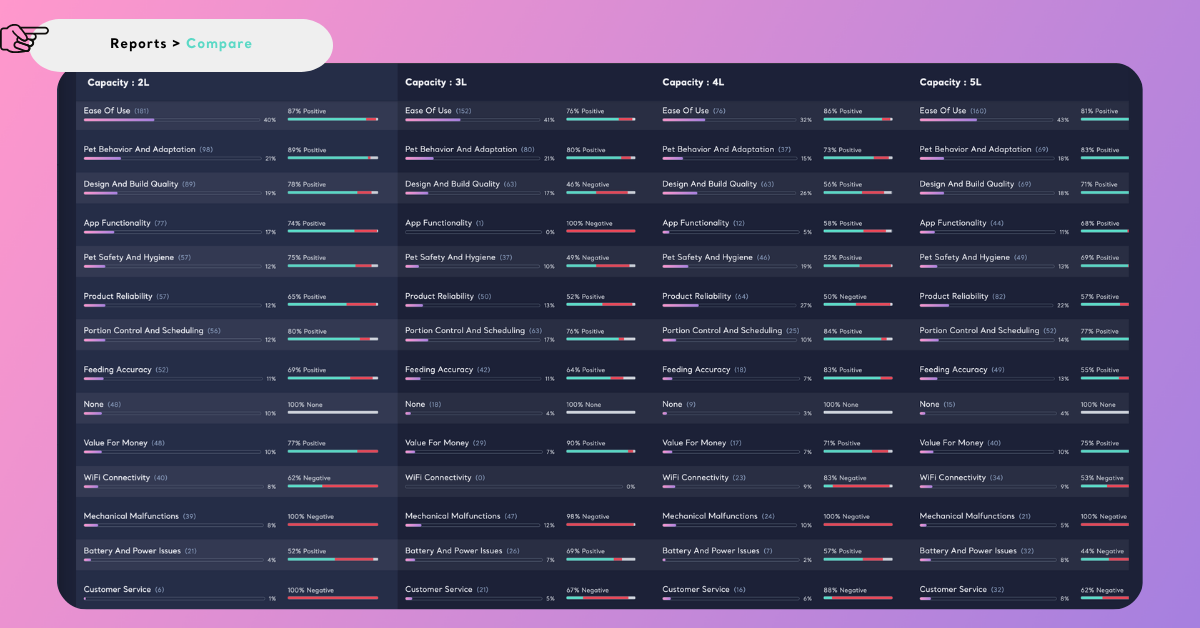
Compare supports up to five values at a time. See the Compare Analyses article to learn more about filtering and comparing structured column values.
Comparing products by Capacity reveals noticeable differences in themes such as Ease of Use, Product Reliability, Feeding Accuracy, and Design & Build Quality. Rather than influencing a single aspect of the experience, feeder size appears to shape how consumers evaluate the product as a whole, suggesting that product configuration plays an important role in customer expectations.
The same approach can be applied to many other business questions. Comparing Power Types reveals how different power configurations influence perceptions of reliability and battery performance, while comparing Connectivity highlights how connected features shape conversations around app functionality, ease of use, and overall product experience.
Rather than creating a new analysis, Compare adds context to the analyses you've already explored. It helps explain which product attributes influence different parts of the customer experience, enabling businesses to make more informed product, design, and positioning decisions.
Once you've completed your analysis, you can export your findings as a PowerPoint presentation for sharing with stakeholders. For step-by-step instructions, see the related Help Center articles on exporting reports.
Conclusion
Customer feedback is more than a collection of product reviews—it's one of the richest sources of consumer intelligence available to businesses. When combined with structured data and analyzed from multiple perspectives, it becomes a powerful resource for understanding customer behavior, identifying improvement opportunities, and supporting better business decisions.
In this tutorial, you've built a complete consumer research report using a fictional automatic pet feeder dataset. Along the way, you've learned how different analyses answer different research questions, how structured product attributes provide valuable context for comparison, and how Signals help connect individual findings into a broader understanding of the customer experience.
Although this tutorial focused on the automatic pet feeder category, the same workflow can be applied across virtually any product or service. Start with a well-structured dataset, select the analyses that best align with your research objectives, and connect your findings to uncover the patterns that matter most.
Now it's your turn. Download the sample dataset, recreate this report in your own Kimola workspace, and start exploring the questions that matter most for your business.
- How to Scrape and Analyze Şikayetvar Complaints
- Creating a Consumer Research Report for the LED Face Mask Category
- Creating a Consumer Research Report for the Portable Juice Blender Category
- Creating a Consumer Research Report for the Air Purifier Category
- Creating a Consumer Research Report for the Instant Camera Category