Creating a Consumer Research Report for the LED Face Mask Category
17 mins read - Updated on Jul 01, 2026Every consumer research project begins with a question. Why do consumers choose a particular product? What shapes a successful experience? Which frustrations emerge most often? Do different customer groups have different expectations? Where are the biggest opportunities for innovation?
In this tutorial, you'll learn how to answer questions like these by building a complete consumer research report in Kimola. To make the process practical, we'll work with a sample dataset created for Lumavant, a fictional LED face mask brand, and use it to explore the category from multiple perspectives.
As you follow along, you'll learn a repeatable workflow for preparing data, understanding your report, interpreting individual analyses, and connecting insights to answer real business questions.
Before we begin, download the sample dataset and upload it to your Kimola workspace. We'll use the same dataset throughout this tutorial as we build our research report step by step.
If you don't already have a Kimola account, sign up first, then sign in and navigate to the Dashboard Home page.
Understanding Your Dataset
Before exploring customer insights, it's important to understand the dataset you'll be working with. The quality of your findings depends not only on the customer feedback you collect, but also on how well your data is organized and enriched with relevant context.
For this tutorial, we've prepared a fictional dataset containing 2,399 e-commerce reviews collected across Lumavant and several competing LED face mask brands. In real-world projects, organizations often already have access to similar customer feedback through their own products, e-commerce platforms, customer surveys, support tickets, social media conversations, or research partners. Once these conversations are organized into a structured dataset, the same research workflow can be applied regardless of where the data comes from.
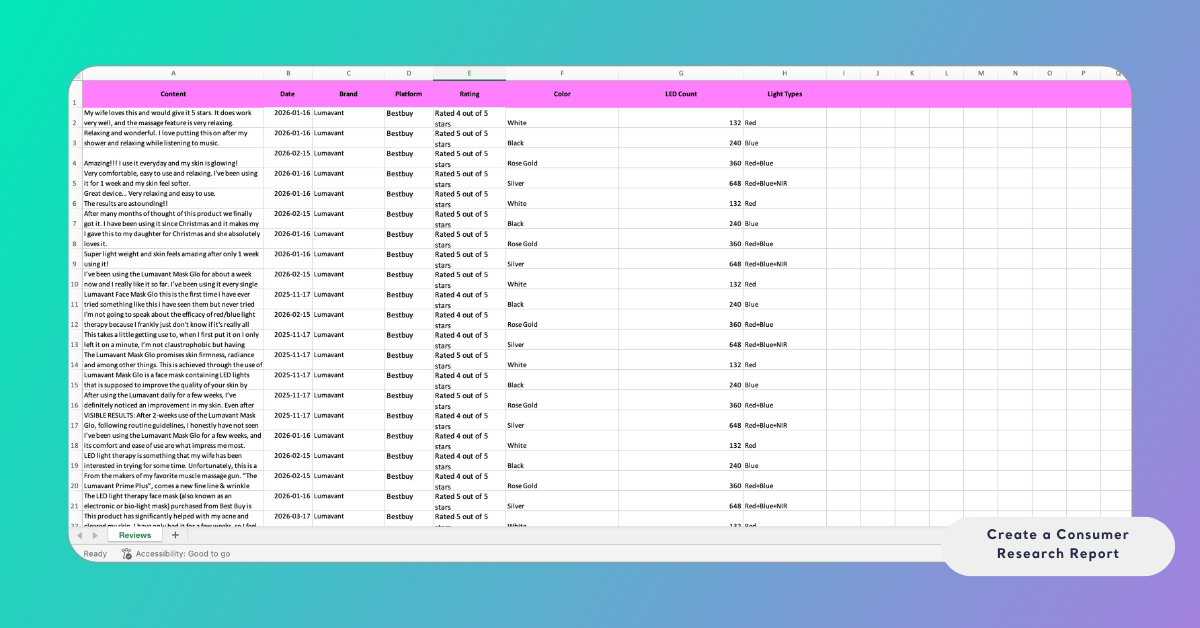
The dataset combines two types of information that work together to support your analysis:
- The first is customer feedback, stored in the Content column. This is the primary source Kimola uses to generate analyses such as Themes, Motivations, Pain Points, etc.
- The second consists of structured columns. Fields such as Brand, Platform, Rating, Color, LED Count, and Light Types provide additional context for every conversation. These columns make it possible to filter data, compare different groups, create tables, and investigate how customer experiences vary across brands, platforms, product variants, and technical specifications.
Before preparing a dataset, think about the questions you may want to answer later. Adding structured information such as brands, platforms, dates, or product attributes from the beginning makes filtering, comparisons, and deeper analysis much easier.
Creating Your Report
With your dataset ready, it's time to create your report in Kimola. Sign in to your account, open the Dashboard Home page, and upload the sample dataset in the Upload your custom dataset section.
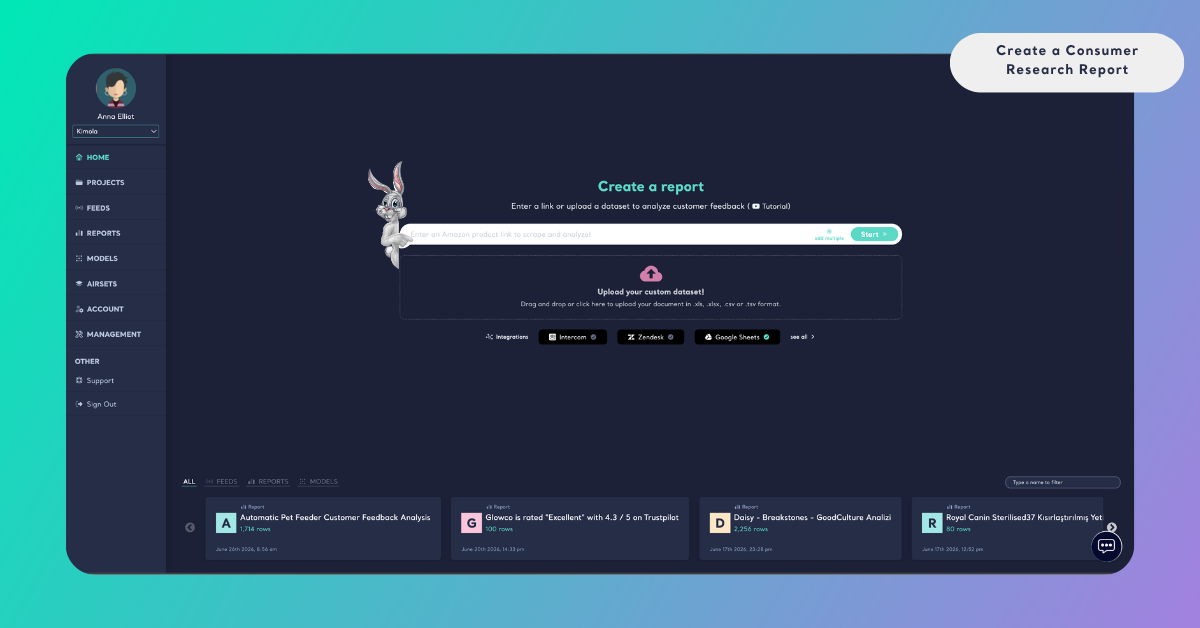
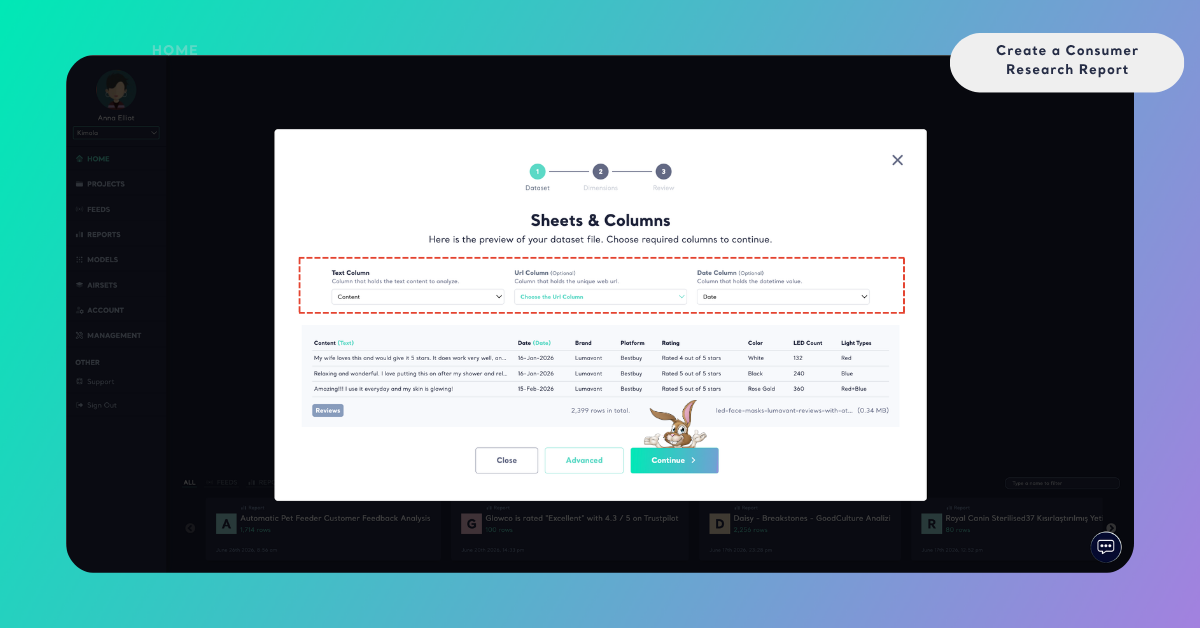
After uploading the file, Kimola guides you through a simple three-step setup process.
First, review your dataset and map the required columns. Set the Content column as the Text Column, then map any additional fields, such as dates or URLs, if they are available.
Next, choose the dimensions you want to include in your report. Each dimension examines customer feedback from a different perspective and is designed to answer a different type of research question.
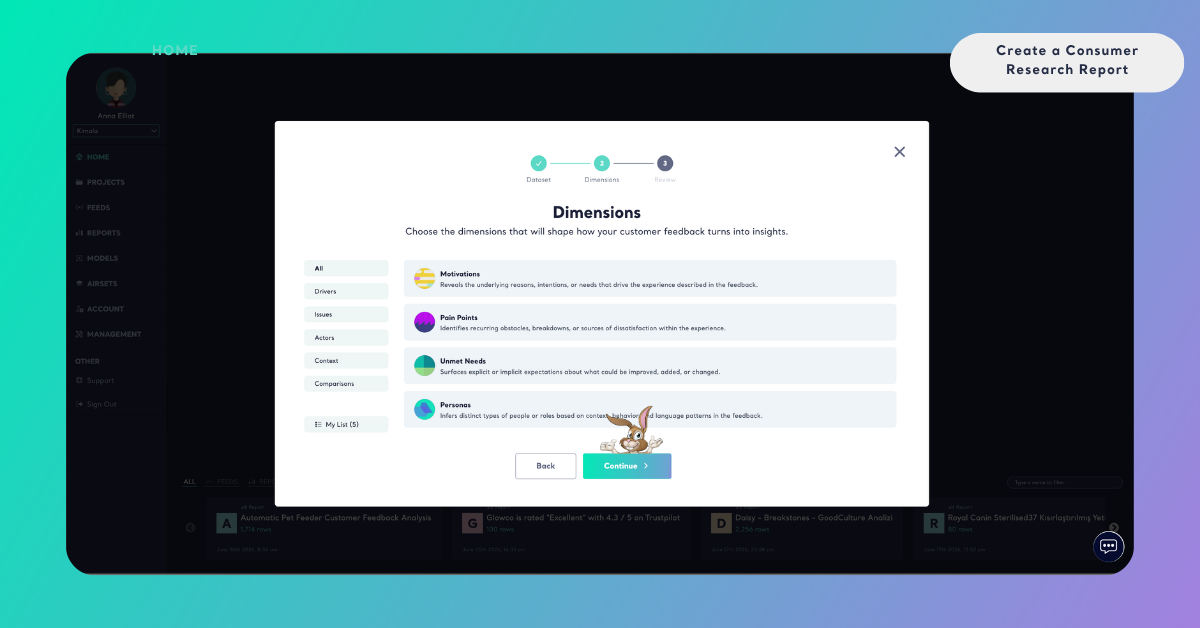
Research questions often evolve as new insights emerge. If you decide to explore additional questions later, you can add new dimensions to your report without creating a new one.
Finally, review your report settings, enter a report name, choose the report language, and click Create Report.
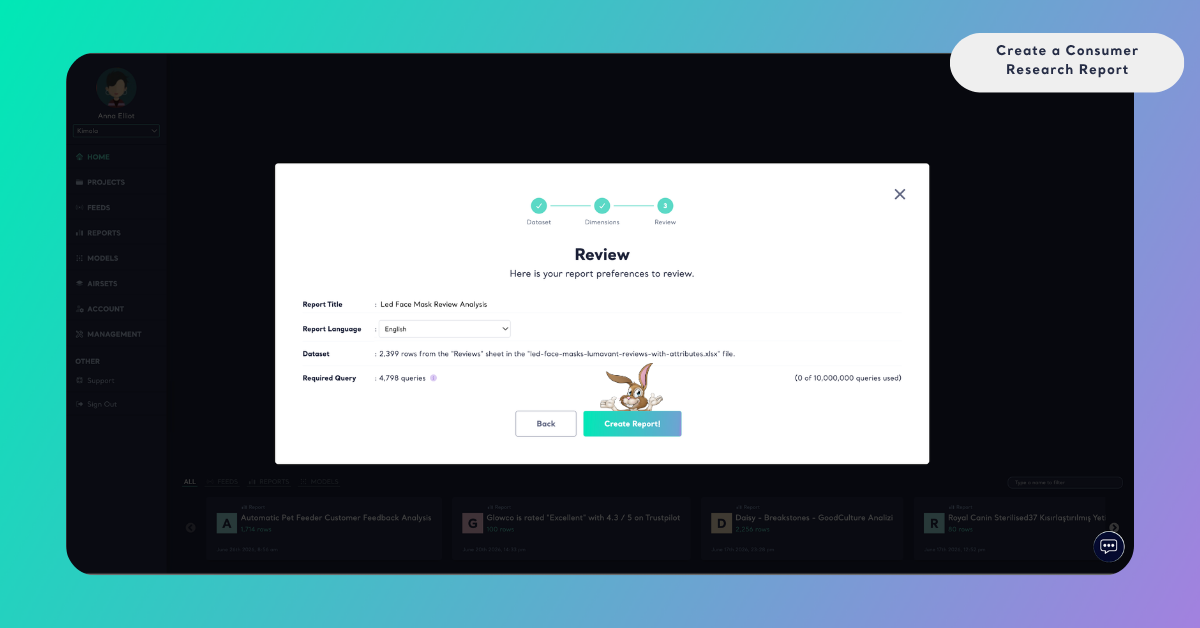
Kimola will process your dataset and generate the selected analyses automatically. Once processing is complete, your report is ready to explore.
A First Look at Your Report
Your report is now ready.
Before diving into individual analyses, it's helpful to take a moment to understand how the report is organized. The Overview page brings together the most important information from your report into a single workspace, providing a high-level summary of both your dataset and the insights generated from it.
Rather than focusing on a single analysis, the Overview combines multiple perspectives into one place. At the top of the page, you'll find automatically generated Signals, followed by overall report statistics such as the number of records analyzed, overall sentiment distribution, and the best and worst performing themes. As you continue scrolling, you'll see preview cards for your selected dimensions, an executive summary, detailed theme summaries, conversation trends over time, and direct access to the original customer feedback.
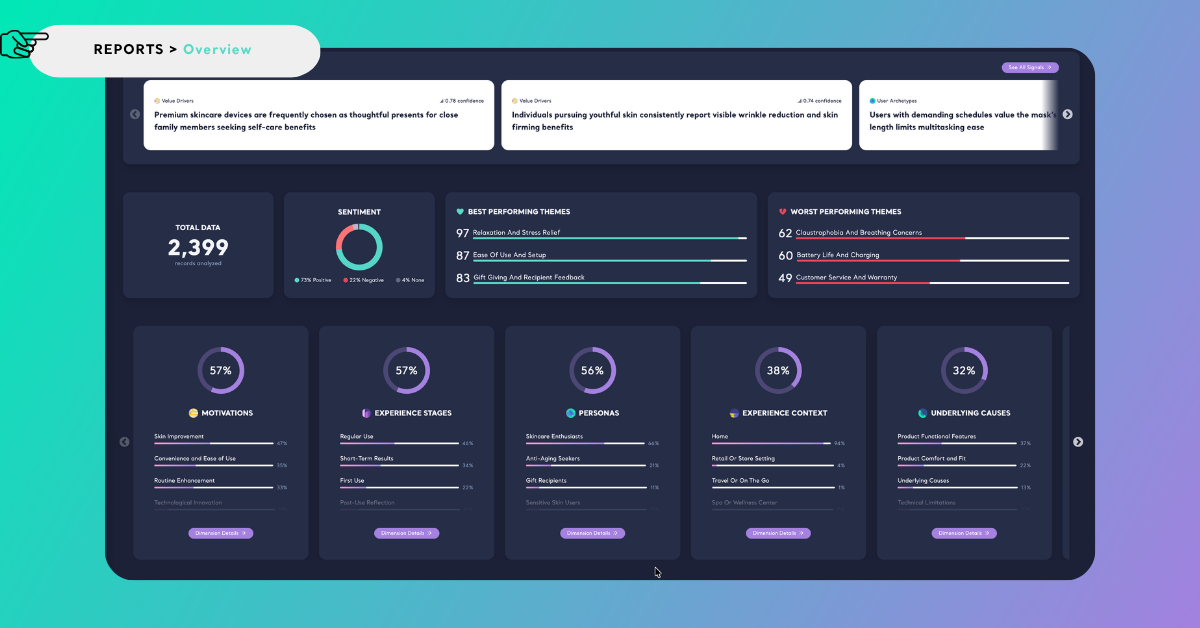
This page is designed to help you quickly understand both your dataset and the overall direction of the research before exploring individual analyses in more detail.
Rather than jumping from one analysis to another, it's helpful to first think about the business question you want to answer. One of the most common mistakes in consumer research is starting with the available analyses instead of the research objective. In practice, the process works the other way around: define the business question first, then use the analyses that best help answer it.
Throughout this tutorial, we'll use the following analyses to answer a series of research questions that build a complete understanding of the LED face mask category.
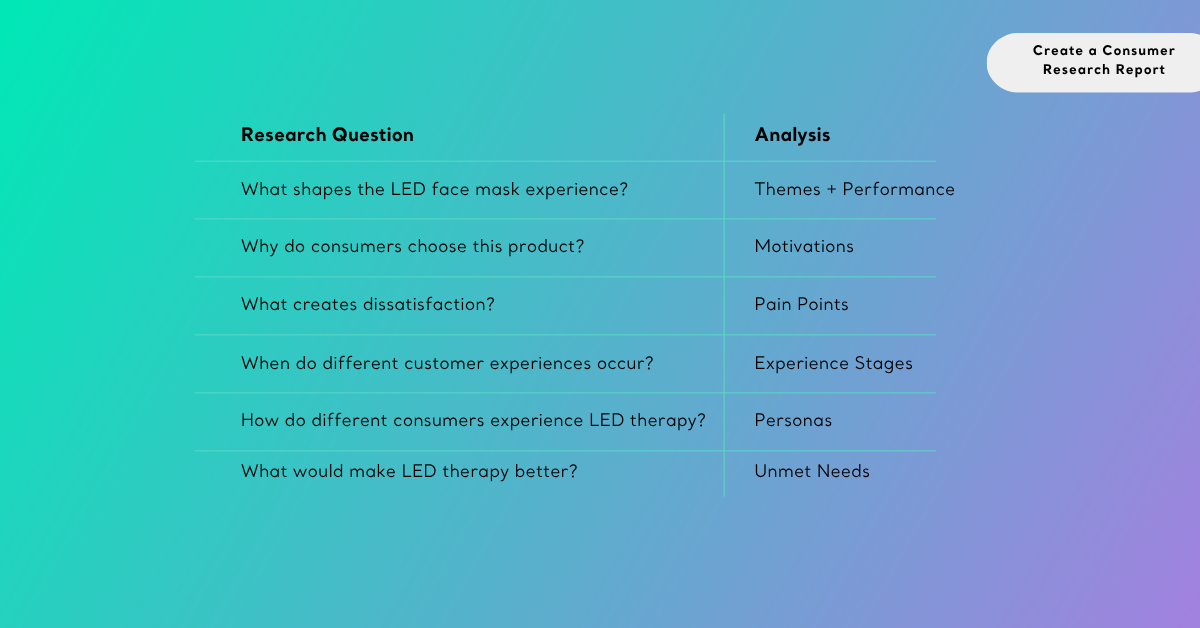
The Overview gives you a snapshot of the report. To better understand the story it tells, we'll start with Signals, which highlight the broader patterns emerging across multiple analyses.
Discovering Patterns with Signals
A single analysis can answer an important research question, but the most valuable consumer insights emerge when findings from multiple analyses are connected. Signals bring these findings together, helping reveal the broader patterns emerging across your report.
Signals are generated automatically when your report includes enough analyses to identify meaningful relationships. If too few dimensions are selected, Signals won't be available.
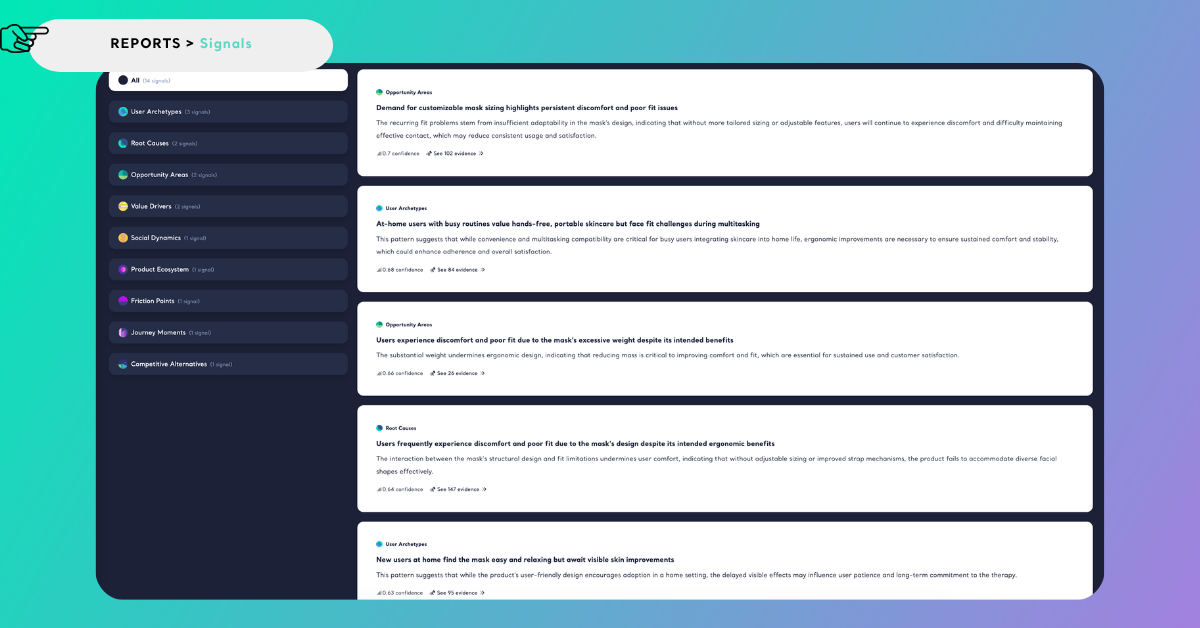
In this report, several Signals point to a consistent story across the LED face mask category. Consumers are primarily attracted to LED face masks because they promise visible skin improvements while fitting naturally into everyday skincare routines. At the same time, these conversations are frequently connected with comfort, fit, and usability challenges, suggesting that product effectiveness alone is not enough to create a satisfying long-term experience.
Other Signals reinforce this pattern by linking recurring comfort concerns with factors such as mask weight, sizing, and overall ergonomics. Together, these relationships highlight opportunities to improve not only product performance but also usability and everyday wearability.
Signals provide a high-level understanding of the category by bringing together insights from across the report. The following analyses explain these patterns in greater detail, providing the context needed to build a complete understanding of the customer experience.
What Shapes the LED Face Mask Experience
Before exploring why consumers purchase LED face masks or identifying opportunities for improvement, it's helpful to understand the category at a broader level. Which aspects of the product dominate customer conversations? And which of those aspects contribute most positively—or negatively—to the overall customer experience?
The Themes analysis identifies the topics that consumers discuss most frequently, revealing the aspects of the product that attract the greatest attention throughout the ownership experience.
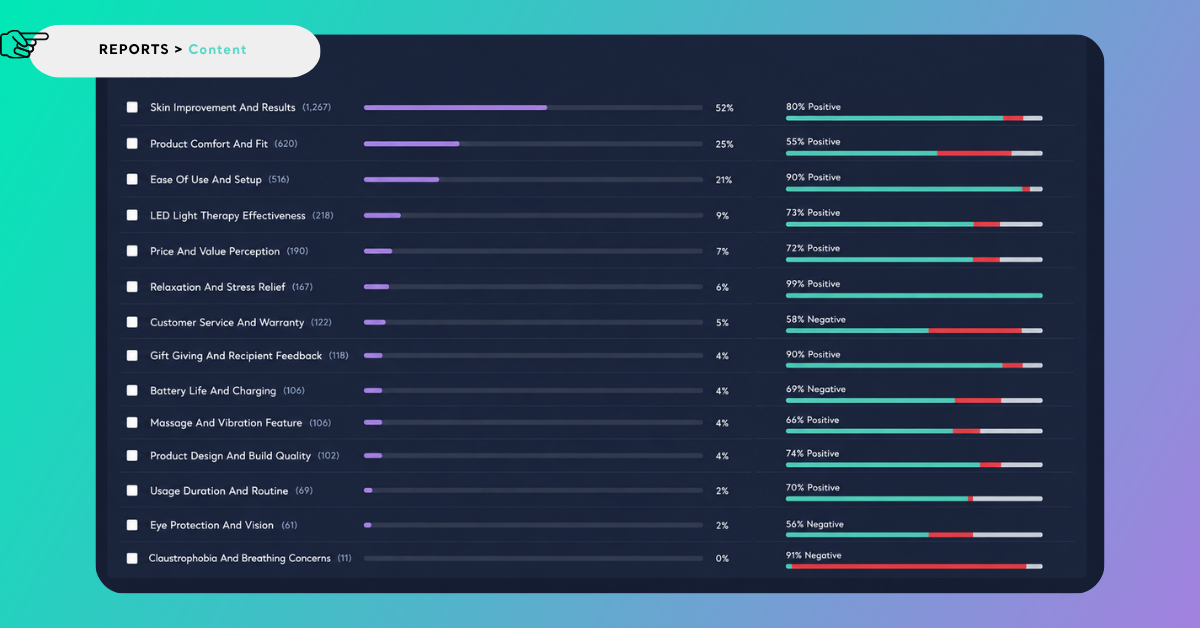
Based on the findings, Skin Improvement & Results dominates customer conversations, accounting for 52% of all theme-related discussions. Consumers frequently describe improvements in skin texture, firmness, brightness, acne, and redness, confirming that product performance remains central to the category.
However, visible results are only part of the experience. Product Comfort & Fit (25%) and Ease of Use & Setup (21%) also appear prominently, showing that consumers evaluate LED face masks not only by the skincare benefits they deliver, but also by how naturally they fit into everyday routines.
While Themes reveal what consumers talk about most, they don't show which aspects of the experience deserve the greatest attention. That's where the Performance dashboard provides additional context.
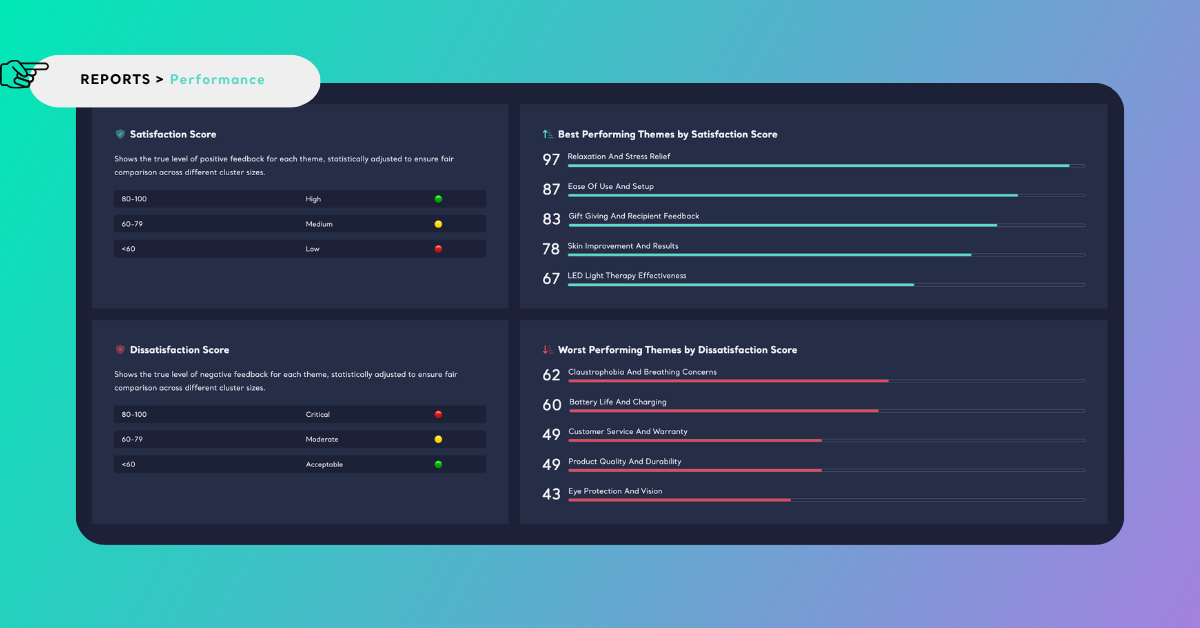
Performance evaluates each theme by considering both its prominence in customer conversations and the overall customer sentiment associated with it. This helps distinguish strengths from areas that require attention and makes it easier to prioritize opportunities for product improvement.
In this dataset, Skin Improvement & Results stands out as one of the category's strongest-performing themes, combining high conversation volume with predominantly positive customer feedback. In contrast, Product Comfort & Fit represents a much larger opportunity for improvement. Although frequently discussed, it generates comparatively weaker performance, suggesting that comfort remains one of the most important factors limiting the overall customer experience.
Themes and Performance explain where the broader patterns identified by Signals come from, revealing both what consumers value most and which aspects of the experience require the greatest attention. With this foundation in place, we can now explore why consumers choose LED face masks in the first place.
Why Do Consumers Choose an LED Face Mask
Understanding what defines the experience is only part of the story. Before evaluating whether a product meets expectations, it's helpful to understand what consumers hope to achieve when they decide to purchase it. The Motivations analysis helps answer that question by revealing the goals, needs, and expectations that drive purchase decisions.
The Motivations analysis identifies the underlying goals, needs, and expectations that drive purchase decisions. Rather than describing the ownership experience, it reveals what consumers are trying to accomplish before they begin using the product.
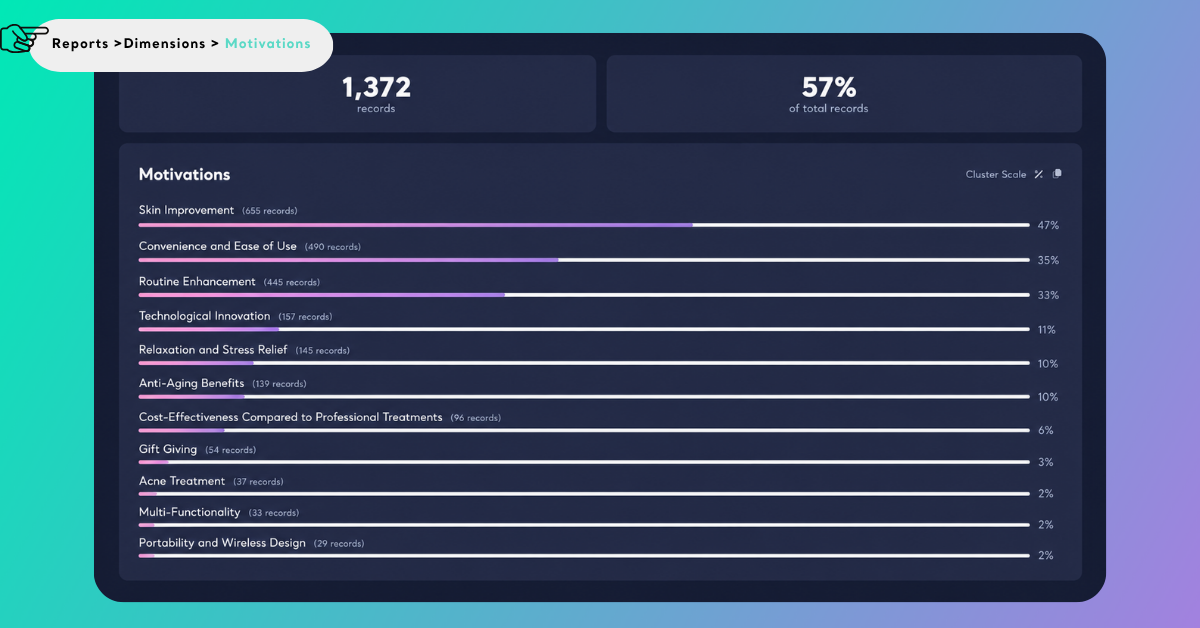
In our example report, Skin Improvement emerges as the strongest purchase driver, accounting for 47% of all motivation-related conversations. Consumers frequently mention improving skin texture, reducing acne, calming redness, and achieving healthier-looking skin, indicating that visible skincare results remain the primary expectation consumers bring into the category.
The analysis also highlights Convenience & Ease of Use (35%) and Routine Enhancement (33%) as major motivations. Rather than viewing LED face masks as occasional beauty devices, many consumers are looking for products that fit naturally into their existing skincare routines and require minimal effort to use consistently.
Together, these motivations show that consumers are purchasing more than a skincare device. They are looking for products that deliver visible results while fitting seamlessly into everyday life.
Understanding why consumers purchase a product is only part of the story. The next step is understanding what prevents them from achieving the experience they expected.
What Gets in the Way of a Great Experience
The Pain Points analysis identifies the recurring barriers that prevent consumers from achieving the experience they expected. Rather than measuring overall sentiment, it uncovers the specific issues that repeatedly undermine satisfaction, helping businesses prioritize the problems with the greatest impact on the customer experience.
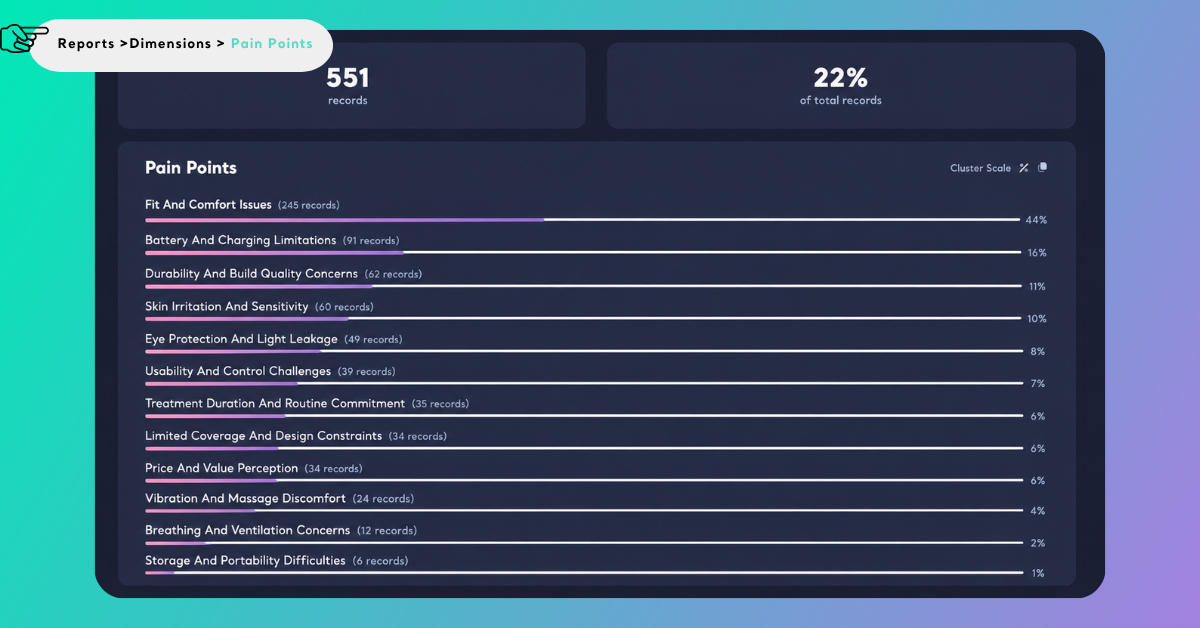
In our example report, Fit & Comfort Issues account for 44% of all pain point-related conversations, making them the category's most significant source of dissatisfaction. Consumers frequently describe masks that feel heavy, create pressure around the nose or eyes, or fail to accommodate different face shapes comfortably.
Other recurring challenges include Battery & Charging Limitations (16%), Durability & Build Quality (11%), Skin Irritation & Sensitivity (10%), and Eye Protection & Light Leakage (8%). Together, these issues show that consumers evaluate LED face masks on much more than skincare performance alone.
Understanding what goes wrong is only the first step. To prioritize improvements, we also need to understand when those challenges emerge throughout the customer journey.
How Does the Customer Journey Evolve
The Experience Stages analysis places customer feedback within the broader ownership journey, revealing when different experiences occur—from first impressions and initial setup to regular use and long-term ownership. Understanding when conversations take place provides valuable context, helping businesses identify the moments that matter most in the customer experience.
Experience Stages identify the stage of the customer journey described in each conversation, not how long a customer has owned the product. For example, a review written six months after purchase may still describe the customer's first use of the product.
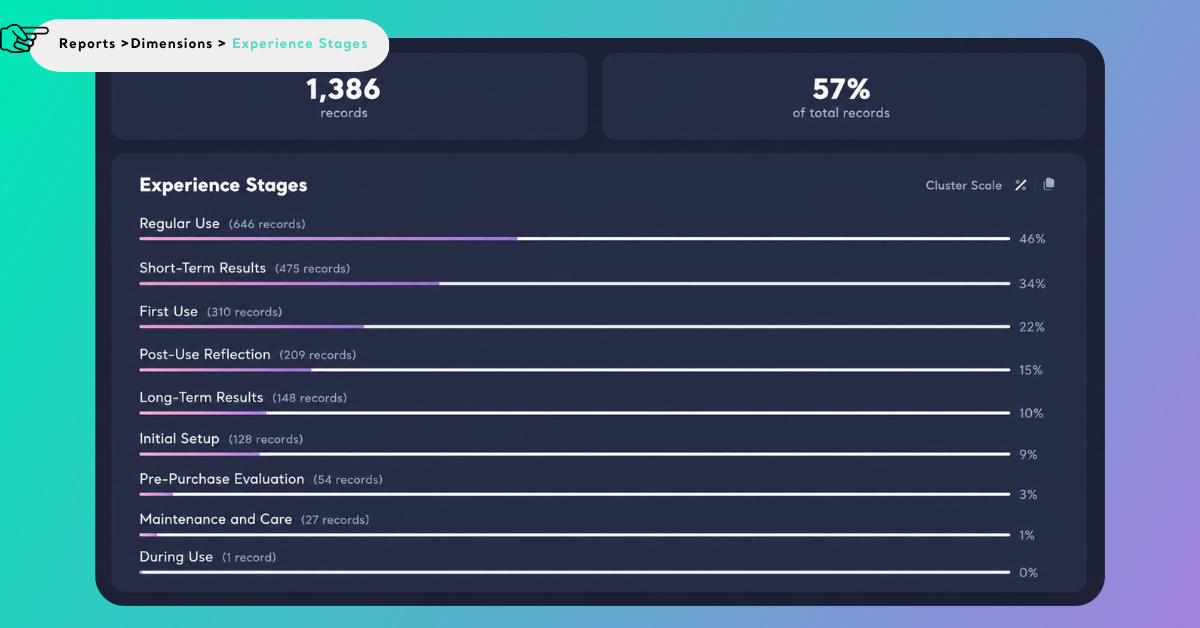
In our example report, most conversations relate to the Regular Use stage, indicating that consumers primarily evaluate LED face masks through their day-to-day experience rather than the purchase itself. Smaller but still meaningful portions of the feedback focus on First Use, Initial Setup, Post-Use Reflection, Maintenance & Care, and Long-Term Results, demonstrating that customer experiences continue well beyond the first treatment session.
Understanding the customer journey is valuable on its own, but combining it with other analyses reveals much richer patterns.
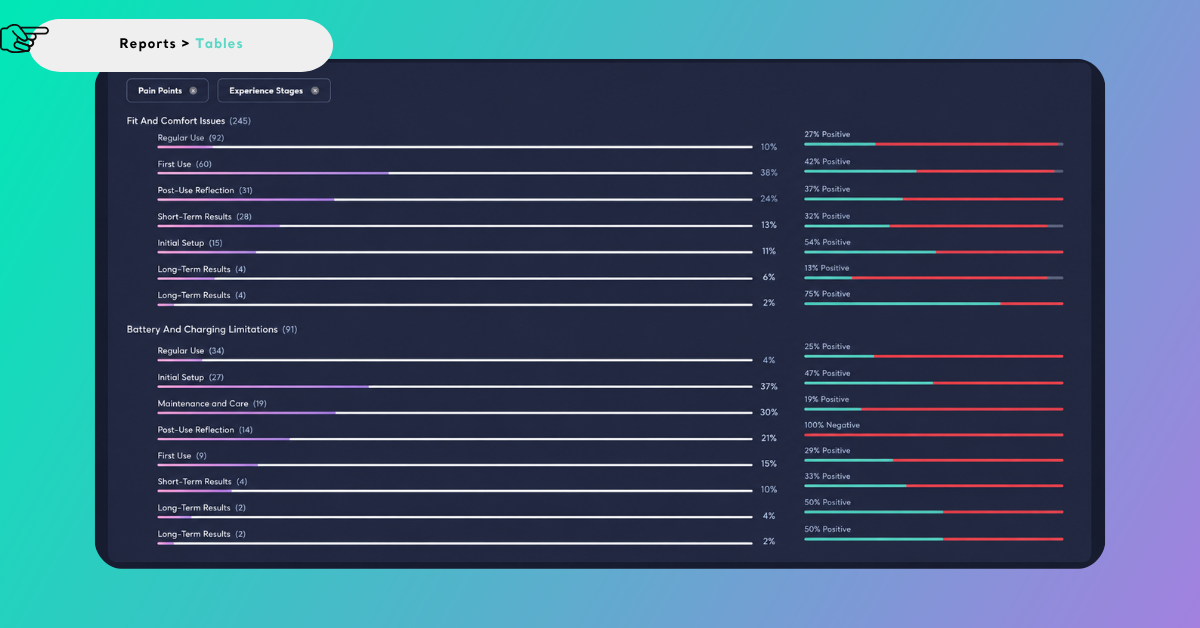
Breaking down Pain Points across different stages reveals how frustrations develop over time. Fit & Comfort Issues appear immediately, occurring most frequently during First Use and continuing throughout Regular Use, suggesting that comfort plays a critical role not only in first impressions but also in long-term adoption.
A different pattern emerges for Battery & Charging Limitations, which span multiple stages of the journey. These conversations begin during Initial Setup, continue throughout Regular Use, and often reappear during Maintenance & Care, indicating that battery-related frustrations persist throughout ownership rather than being tied to a single moment.
Meanwhile, Durability & Build Quality concerns become more prominent during Post-Use Reflection, when consumers begin evaluating the product's long-term reliability. Similarly, Skin Irritation and Eye Protection issues are discussed primarily during Regular Use, highlighting challenges that become apparent only after repeated treatments.
By combining Experience Stages with Pain Points, we move beyond identifying what consumers struggle with and begin understanding when those challenges are most likely to occur.
The next question is whether those experiences are shared by all consumers or vary across different consumer groups. To answer that, we'll explore the Personas analysis.
How Do Different Consumers Experience LED Therapy
Customer feedback rarely represents a single type of consumer. People enter the same category with different goals, routines, and expectations, meaning that the same product can be experienced in very different ways.
The Personas analysis identifies distinct consumer groups based on the language, behaviors, situations, and goals described in customer feedback. Rather than grouping consumers by demographics, it reveals meaningful behavioral segments that help explain why customer experiences often differ.
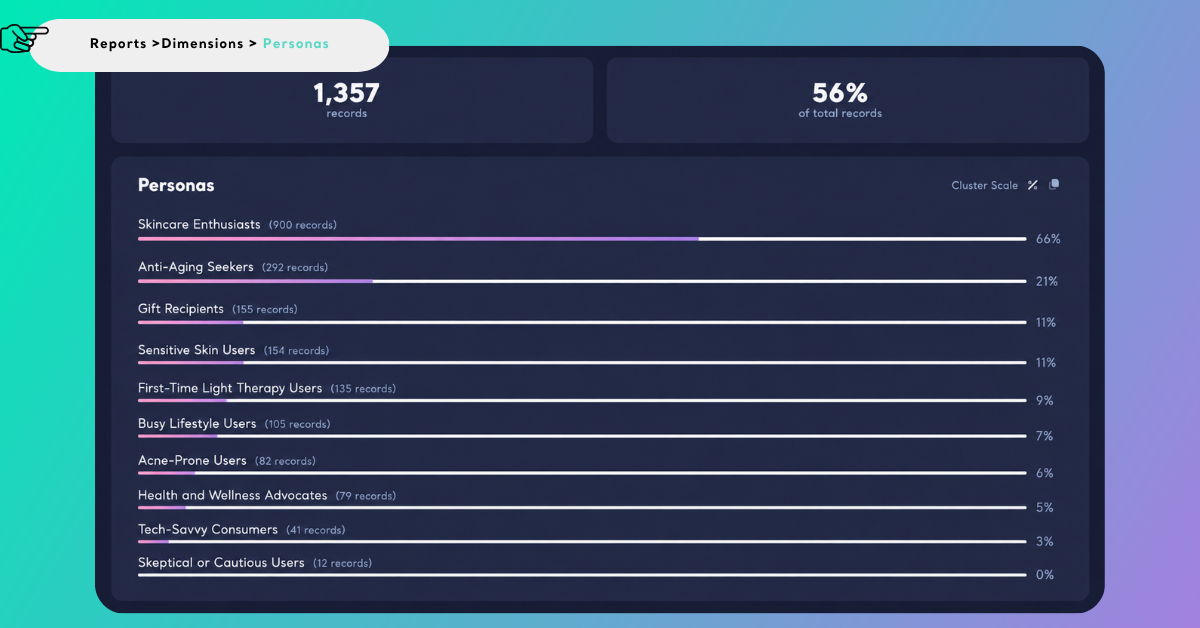
The analysis identifies several recurring consumer groups, including Skincare Enthusiasts, Anti-Aging Seekers, First-Time Light Therapy Users, Sensitive Skin Users, Busy Lifestyle Users, and Health & Wellness Advocates. Although they all purchase LED face masks, they enter the category with different expectations and evaluate success through different lenses.
Personas become even more valuable when combined with other analyses.
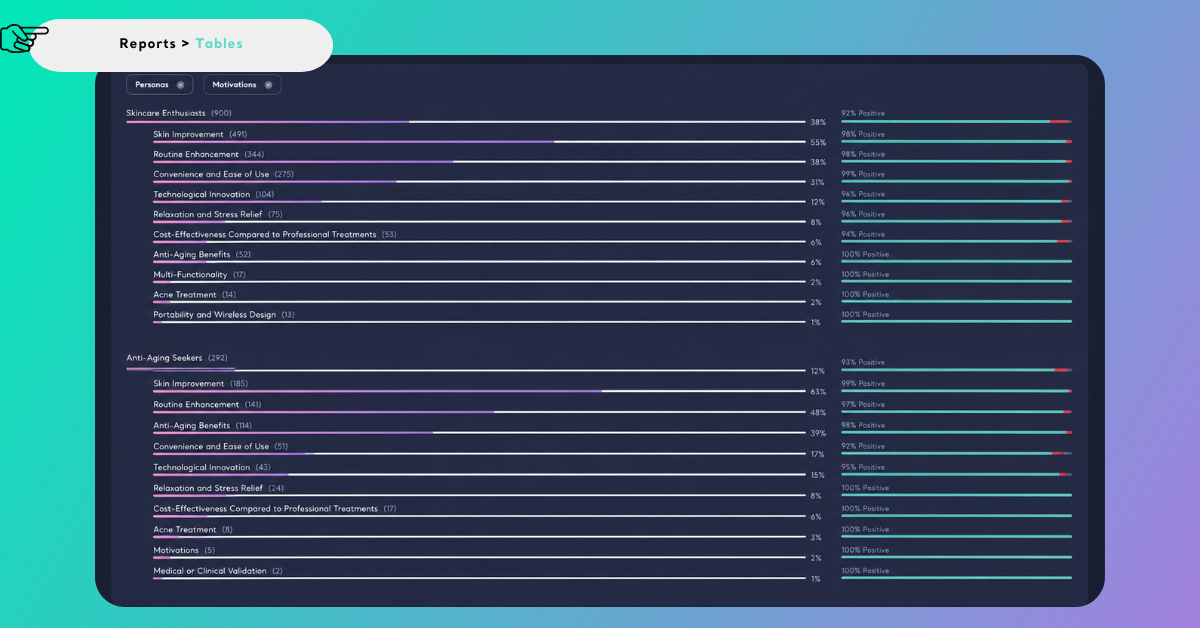
Looking at Motivations across different personas reveals clear differences in purchase drivers. Skincare Enthusiasts are primarily motivated by visible skin improvements and view LED therapy as a natural extension of their skincare routines. Anti-Aging Seekers place much greater emphasis on long-term anti-aging benefits, while First-Time Light Therapy Users are more strongly motivated by convenience and ease of use, suggesting that reducing complexity is particularly important for consumers entering the category for the first time.
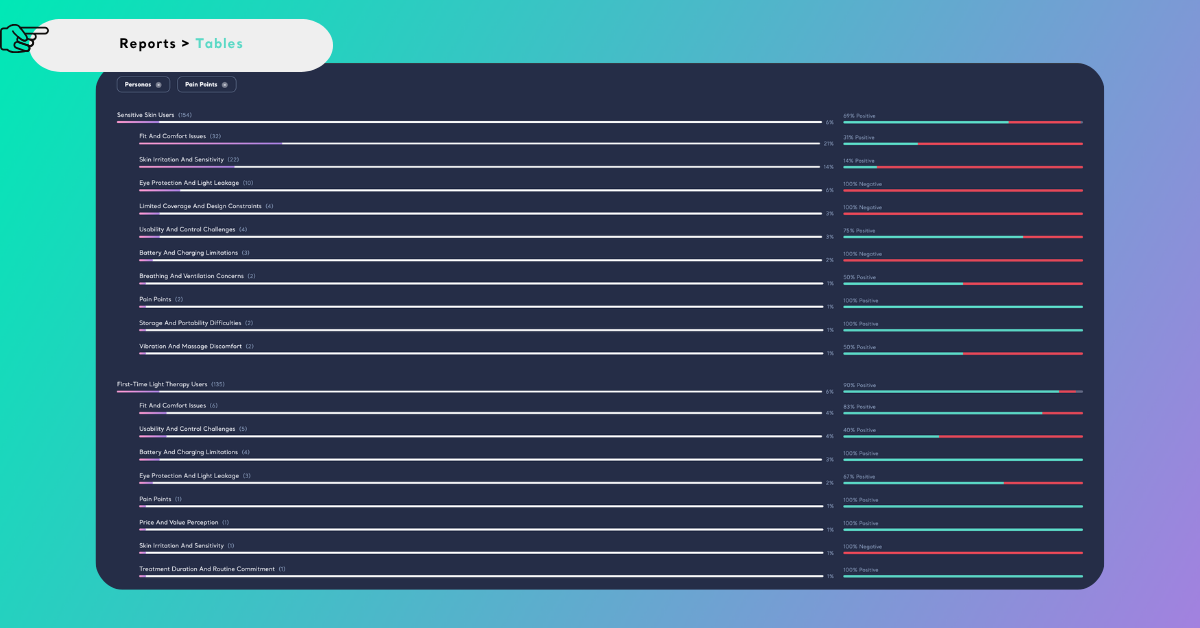
Behavioral differences also become apparent when examining Pain Points across personas. While Fit & Comfort Issues remain the most common pain point overall, they are particularly prominent among Sensitive Skin Users, who also report higher levels of Skin Irritation & Sensitivity and Eye Protection & Light Leakage. These findings suggest that comfort and skin compatibility are especially important for consumers with more sensitive skin.
A different pattern emerges among First-Time Light Therapy Users. Although Fit & Comfort Issues remain their most frequently discussed challenge, their feedback also highlights Usability & Control Challenges and Battery & Charging Limitations, indicating that ease of operation and a smooth first-use experience play an important role for consumers who are new to LED therapy.
Together, these findings show that different consumer groups experience different barriers throughout their journey. Understanding these differences helps businesses prioritize improvements that address the specific needs of different types of consumers.
Those differences also shape the improvements consumers expect from the category. To identify those opportunities, we'll explore the Unmet Needs analysis.
What Would Make LED Therapy Better
Not every opportunity for improvement appears as a complaint. Consumers often describe features they wish existed, capabilities they would like to see, or experiences they believe could be better—even when they are generally satisfied with a product.
The Unmet Needs analysis captures these expectations by identifying improvements and opportunities expressed throughout customer conversations. Rather than focusing on existing problems, it highlights where consumers believe the experience could be enhanced.
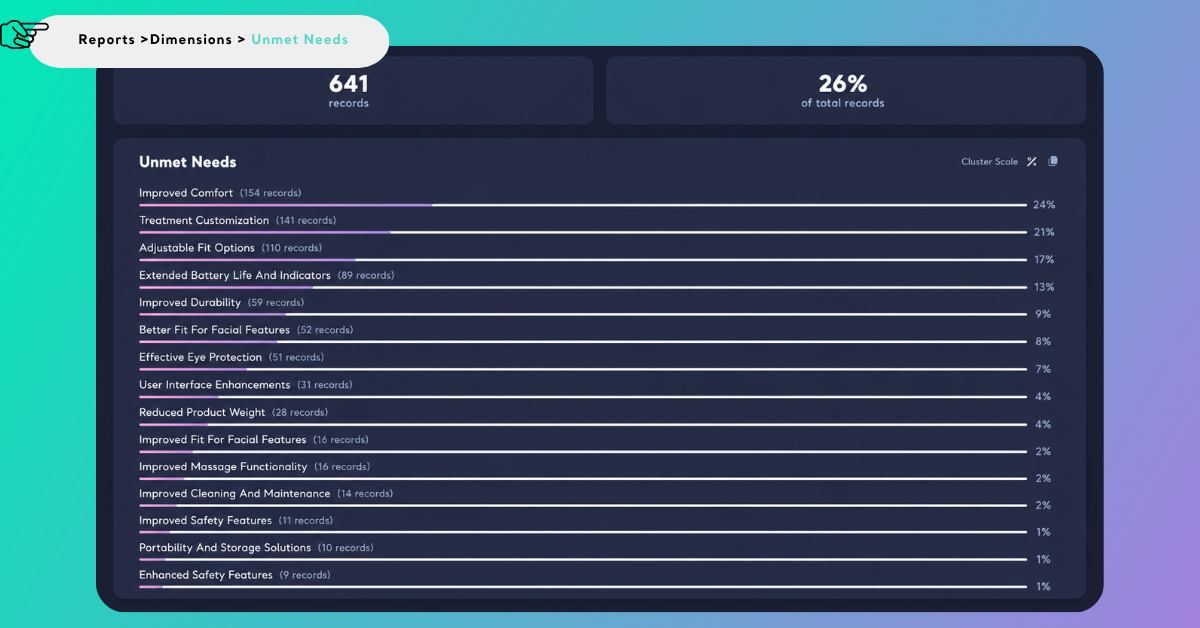
Across the category, the most frequently mentioned unmet needs relate to comfort, adjustable sizing, treatment customization, battery life, eye protection, lighter product weight, and easier maintenance. Although LED face masks are generally perceived as effective skincare devices, consumers continue to identify opportunities to improve the overall ownership experience.
Category-level insights provide a useful starting point. Combining Unmet Needs with Personas reveals where those opportunities become most meaningful.
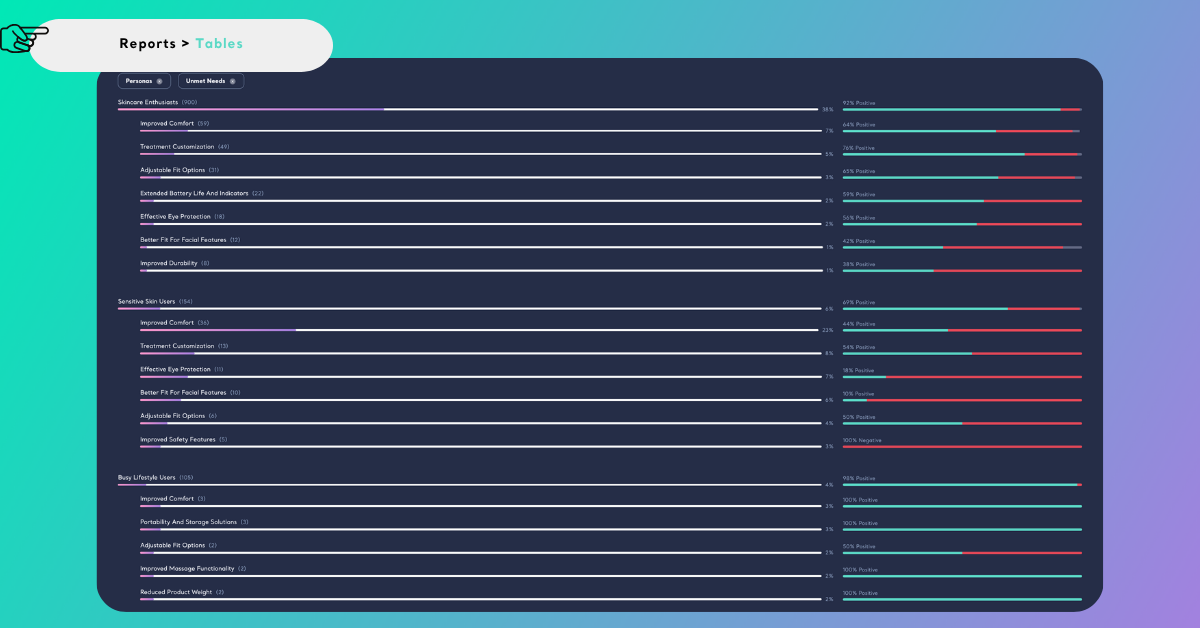
Different consumer groups prioritize different improvements. Busy Lifestyle Users most frequently request lighter products and greater portability, reflecting their desire to integrate LED therapy more naturally into busy schedules. Sensitive Skin Users emphasize better facial fit and improved eye protection, while Skincare Enthusiasts are more likely to request greater comfort, adjustable treatment options, and personalized treatment experiences.
Looking at unmet needs through the lens of personas transforms a broad list of customer requests into focused innovation opportunities. Instead of designing a single solution for every consumer, businesses can prioritize improvements based on the expectations of specific customer groups.
Where Do LED Face Masks Differ
Up to this point, we've explored customer feedback at the category level. However, many business questions require comparing experiences across brands, product variants, platforms, or other structured attributes.
This is where structured columns become valuable. Rather than generating a new analysis, they allow you to examine an existing analysis across different values such as Brand, Platform, Rating, Light Type, or LED Count.
For example, you might ask:
Which customer experience themes are our competitive strengths, and where do competitors outperform us?
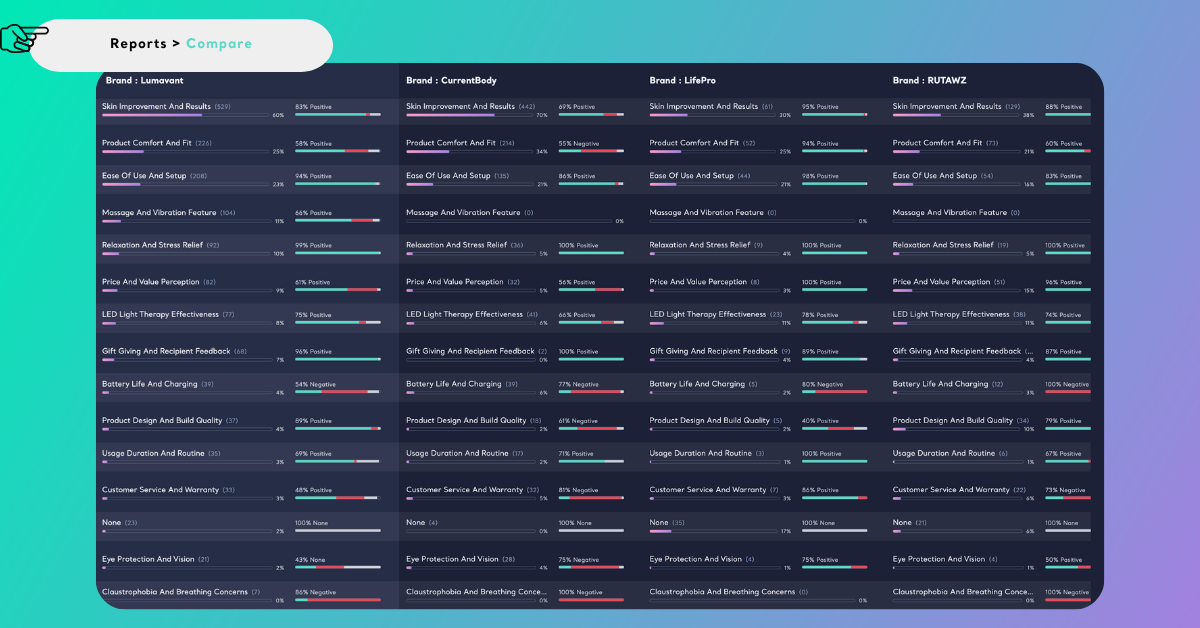
Using Compare, we can break down the Themes analysis by Brand, revealing how each brand performs across specific aspects of the customer experience rather than comparing overall brand sentiment.
Compare supports up to five values at a time. See the Compare Analyses article to learn more about filtering and comparing structured column values.
In our example report, Lumavant performs particularly well in Ease of Use & Setup and Relaxation & Stress Relief, while Product Comfort & Fit remains an area where competing brands receive stronger customer feedback, highlighting a clear opportunity for product improvement.
The same approach can answer many other business questions:
- Which Light Type is most strongly associated with positive Skin Improvement & Results? → Compare Themes by Light Type.
- Do customer conversations differ across review platforms? → Compare Themes by Platform.
- Which pain points are most common in low-rated reviews? → Compare Pain Points by Rating.
- How do customer experiences differ across LED configurations? → Compare Themes or Pain Points by LED Count.
By comparing analyses across structured attributes, you can move beyond category-level insights and understand how products, customer segments, and product characteristics influence the overall experience.
Conclusion
Customer feedback contains far more than individual opinions. When analyzed alongside structured data and viewed from multiple perspectives, it becomes a powerful source of consumer intelligence that helps businesses understand not only what consumers say, but also why they behave the way they do.
In this tutorial, you've built a complete consumer research report using a fictional LED face mask dataset. Along the way, you've learned how different analyses answer different business questions, how structured data enables deeper exploration, and how connecting insights across multiple analyses leads to a more complete understanding of the customer experience.
Although this tutorial focused on the LED face mask category, the same workflow can be applied to virtually any product or service. Start with a well-structured dataset, identify the business questions you want to answer, explore the analyses that best address those questions, and connect your findings to uncover meaningful consumer insights.
Now it's your turn. Download the sample dataset, recreate this report in your own Kimola workspace, and start exploring the questions that matter most for your business.
- How to Scrape and Analyze Ekşi Sözlük Entries
- How to Scrape and Analyze Şikayetvar Complaints
- Creating a Consumer Research Report for the Automatic Pet Feeder Category
- Creating a Consumer Research Report for the Portable Juice Blender Category
- Creating a Consumer Research Report for the Air Purifier Category