10 Tools for Market Researchers: From Desk Research to Reporting
Oct 27, 2026 - 14 minute read
A market research project usually moves through the same steps, and each step has its own typical tools. For desk research and market sizing, researchers use Statista and Semrush. To see where demand is heading, they use Glimpse. To collect primary data, they build surveys in Jotform and recruit participants through Prolific, and to understand people in their everyday context, they run mobile ethnography studies in Indeemo. Meltwater monitors media and social conversations, Kimola analyzes customer feedback at scale, and Tableau and Visme turn the findings into dashboards and reports.
Few projects need all ten. Most start with a source of secondary data, a survey tool and a way to present results, and add the others as the questions get harder. One source is often overlooked: the customer feedback that already exists, in reviews, survey comments and support conversations. For a broader introduction to the discipline, see our guide to market research.
This guide is written by the Kimola team. Kimola is our product, so we explain where it fits and where it doesn't, and we describe every other tool based on its public documentation.
What Market Researchers Need From Their Tools
Market research is the work of answering a business question with evidence about customers, competitors and markets. A typical project starts with a clear question, checks what is already known through secondary data, collects new primary data where the gaps are, analyzes it, and presents the answer in a form decision-makers can use.
Each step asks something different of a tool. Secondary research needs reliable, citable data. Primary research needs a way to ask good questions and reach the right people. Qualitative work needs context that numbers can't capture, and analysis needs a method that holds up when someone asks how a finding was reached. Reporting needs clarity more than decoration.
How We Chose These Tools
We included a tool only if it is a primary tool for at least one step of a market research project and is widely used by researchers or marketing teams doing research. We looked at what each tool does at that step, whether it can be evaluated on a free plan or trial, whether its pricing is published, and how well it works alongside the other tools. Pricing for each tool comes from its own pricing page.
We left out website optimization and SEO tools. They answer useful questions about a company's own website, but they are not the tools a researcher uses to understand a market.
Desk Research and Market Sizing
Statista
Statista is a statistics and market data platform. Researchers use it to find market sizes, industry figures and consumer survey results from many sources in one place, and to download charts and data for reports. It is often the fastest way to check what is already known before a project spends money on new data.
Statista works best as a starting point. Its figures come from a mix of its own surveys and third-party sources, so for any number that will carry a decision, researchers should check the original source and methodology that Statista cites.
Pricing: The Basic account is free and includes free statistics only. Starter costs $199 per month and Personal $649 per month, both billed annually, and Professional is priced on request. Plans are listed on Statista's account page.
Semrush
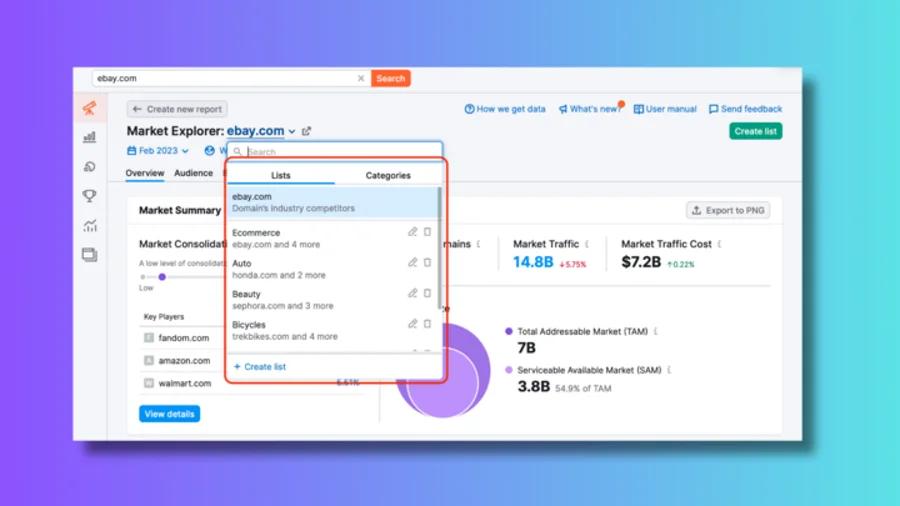
Semrush is best known for search marketing, and its Traffic & Market toolkit is used for digital market analysis. Dashboards such as Traffic Analytics, Market Overview and Competitor Monitoring show how much web traffic the players in a market receive, how their shares shift and where their visitors come from. Semrush became part of Adobe when Adobe completed its acquisition on April 28, 2026.
For researchers, this is a quick way to size the online side of a market and see which competitors are gaining attention. The data is based on estimates of web traffic, so it describes digital behavior and does not cover offline sales or channels outside the web.
Pricing: Traffic & Market Pro costs $289 per month for one user, with a 7-day free trial. Team pricing is available on request.
Spotting Demand and Trends
Glimpse
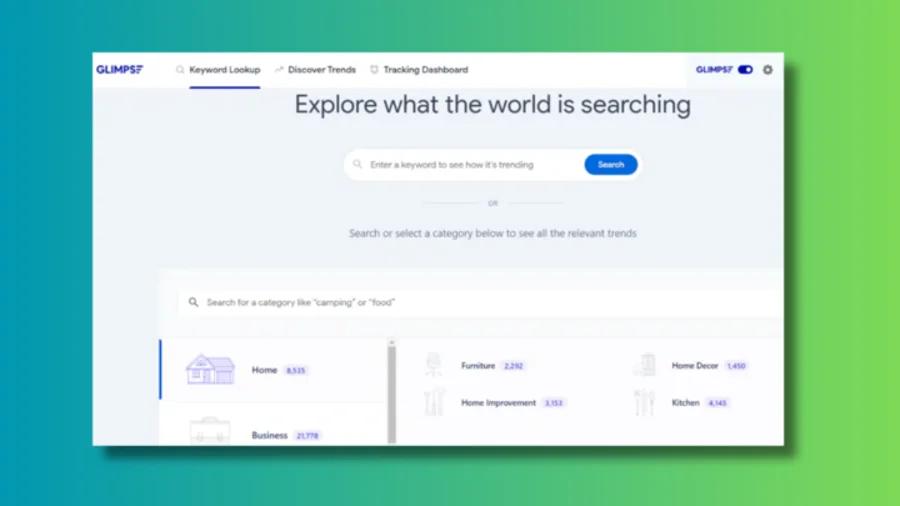
Glimpse is a trend discovery platform built on search data. It maintains a library of trends across categories, shows absolute search volume and growth for any keyword, breaks down where a topic is being discussed, such as TikTok, Reddit and YouTube, and sends alerts when followed topics rise or fall. Its Chrome extension adds search volume figures to Google Trends.
Researchers use Glimpse to check whether interest in a category or product idea is growing, flat or seasonal before investing in primary research. Search interest shows what people are curious about, not why, so it is most useful as an early signal that other methods then explain.
Pricing: Glimpse offers a free account. Pricing for paid plans is not published on its website.
Collecting Primary Data
Jotform
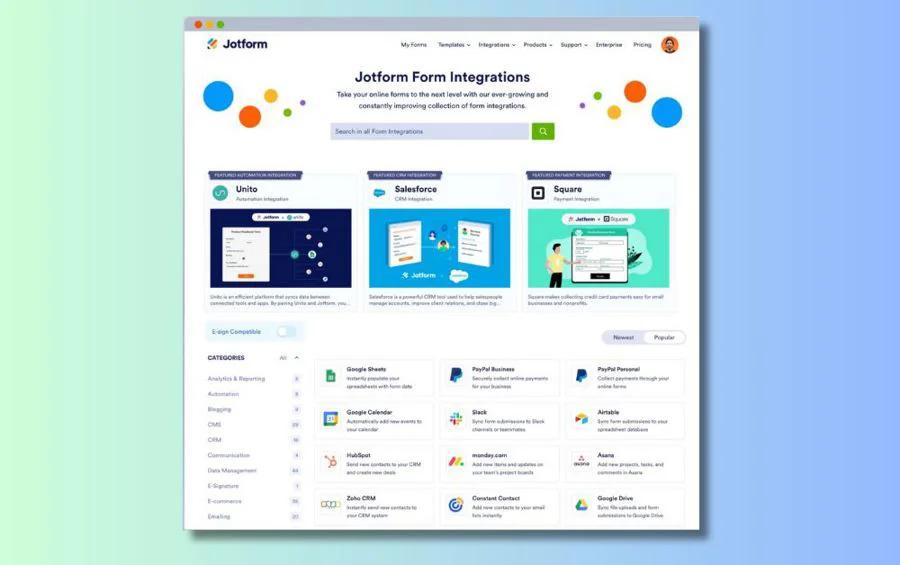
Jotform is an online form and survey builder. Researchers can create surveys from templates, add conditional logic, collect responses on any device and export the results. Its large template library and integrations make it a quick option for straightforward questionnaires.
Jotform is a general-purpose form tool. Projects that need complex sampling, quotas or advanced survey methodology are usually better served by a dedicated research survey platform.
Pricing: Jotform has a free Starter plan, and paid plans start at $19 per month.
Prolific
Prolific is a participant recruitment platform for online research. It gives researchers access to a pool of more than 200,000 active, vetted participants who can be filtered by demographics and other criteria. A study built in another tool, such as a Jotform survey, is connected by pasting its link.
Prolific answers the question of who will take the survey. It is widely used in academic research and increasingly in market and consumer research. Its pool is an online panel, so studies that need hard-to-reach professional audiences or offline populations may need a specialist recruiter.
Pricing: Prolific charges a platform fee on top of participant rewards: 42.857% for corporate customers and 33.3% for academic and nonprofit researchers. The recommended participant rate is $12 per hour, with a minimum of $8 per hour.
Understanding People in Context
Indeemo
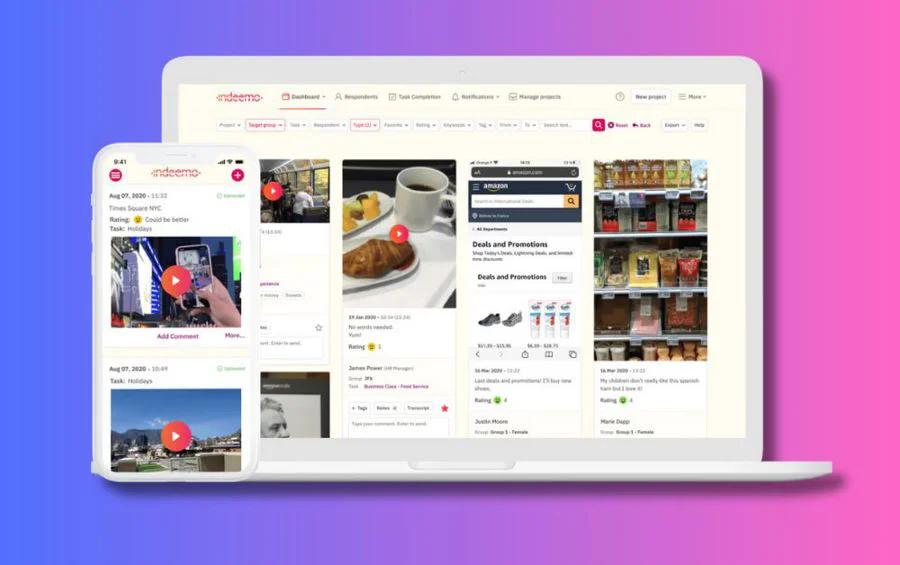
Indeemo is a mobile ethnography and qualitative research platform. Participants record their everyday lives on their own phones over days or weeks, sharing videos, photos, screen recordings and text entries. Researchers get automatic transcription and translation in more than 30 languages, themes linked to specific clips and highlight reels for stakeholders.
Mobile ethnography shows behavior where it happens: how people shop, cook, use a product or make a decision at home. It is a qualitative method, so it is designed for depth with a small number of participants, not for measuring how common a behavior is across a market.
Pricing: Indeemo's pricing is not published and is available through a demo.
Monitoring Public Conversations
Meltwater
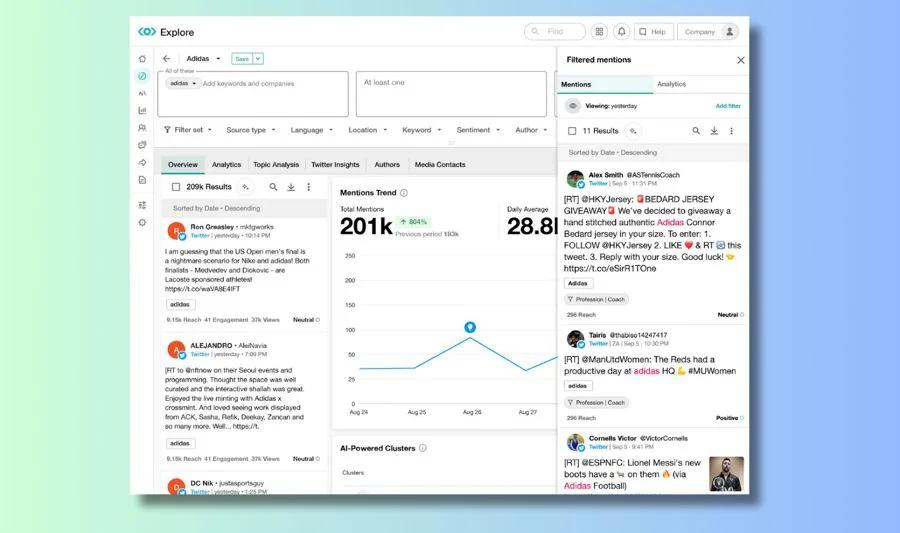
Meltwater is a media intelligence and social listening platform. It tracks coverage across news and social media, flags shifts in sentiment and volume, and also offers AI visibility tracking, which shows how AI platforms describe an organization. PR, communications and marketing teams use it to monitor their brand and competitors in real time.
For researchers, Meltwater is valuable when the question is what is being said right now, by whom and how widely. It is built for ongoing monitoring across a very broad set of sources, which also means it is usually bought as an annual program rather than for a single study.
Pricing: Meltwater's pricing is not published and is tailored to the modules and scale chosen. Starter, Pro, Enterprise and Agency plans are available through sales.
Analyzing Customer Feedback
Kimola
Kimola is an AI platform that turns customer feedback into enterprise-grade market research. Researchers analyze the feedback they already have, such as open-ended survey responses, reviews, support tickets and call transcripts, or collect public reviews by pasting a link. Where social listening tracks what is being said, Kimola is built to explain why people say it.
Much of the customer data a researcher needs already exists online. By pasting a link to a product page on Amazon, Trustpilot, Google Play, the App Store and other platforms, a researcher can collect and analyze the reviews on that page, including the pages of competitors. This makes it possible to study what customers in a category value and complain about without fielding a new survey. Feedback in more than 30 languages is analyzed together, which helps in multi-country studies.
Kimola finds themes in the data itself, without predefined labels, and gives each theme mentioned in a comment its own sentiment, which is known as aspect-based sentiment. It also asks every comment research questions called Dimensions, such as Motivations, Pain Points, Unmet Needs, Personas and Experience Stages. These are the questions a researcher would ask in a qualitative study, applied consistently to thousands of comments.
Method matters to researchers, and this is where Kimola differs most from general text analytics. If your data has columns such as country, brand or customer type, Kimola compares every theme and Dimension across them and over time, and only statistically significant differences become Signals. If price complaints are concentrated in one country, that appears as a Signal only if the difference is unlikely to be chance. Scores are deterministic, so the same data always produces the same ranking, and they account for how many comments a theme has: a theme with 43 positive comments out of 50 ranks above one with 5 out of 5. Action Plans then turn the analysis into recommendations and keep only those the feedback supports. You can see examples of research published on Kimola.
Kimola does not design or send surveys, recruit participants or run interviews and ethnography, and it is not a real-time social media monitoring dashboard. It analyzes the data that the other tools in this list collect, and the feedback that already exists online. The free Starter plan is limited to 150 queries per month, and Spaces and Funnels, used for ongoing feedback programs, are available only on the Enterprise plan.
Pricing: Kimola has a free Starter plan with no credit card required. Paid plans start at $49 per month, and pricing is public. Larger organizations work with an account manager on the Enterprise plan.
Kimola fits researchers who have more open-ended data than they can code by hand, or who want to study a market through its customers' own words, and need findings they can defend.
Visualizing and Reporting Findings
Tableau
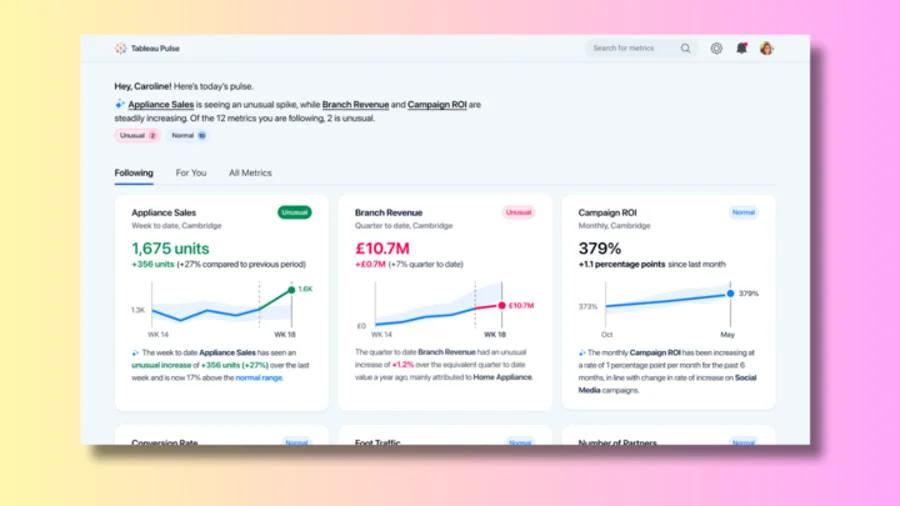
Tableau is a visual analytics platform. Researchers use it to combine data from several sources, explore it through interactive charts and publish dashboards that stakeholders can filter themselves. It is a strong choice for tracking studies and recurring reports where the same views are updated over time.
Tableau takes time to set up and learn, so for a single presentation of a one-off study, a design tool or a spreadsheet may be enough.
Pricing: Tableau Public and Tableau Desktop Free Edition are free. Tableau Standard starts at $15 per user per month and Tableau Enterprise at $35 per user per month, with all products on annual contracts.
Visme
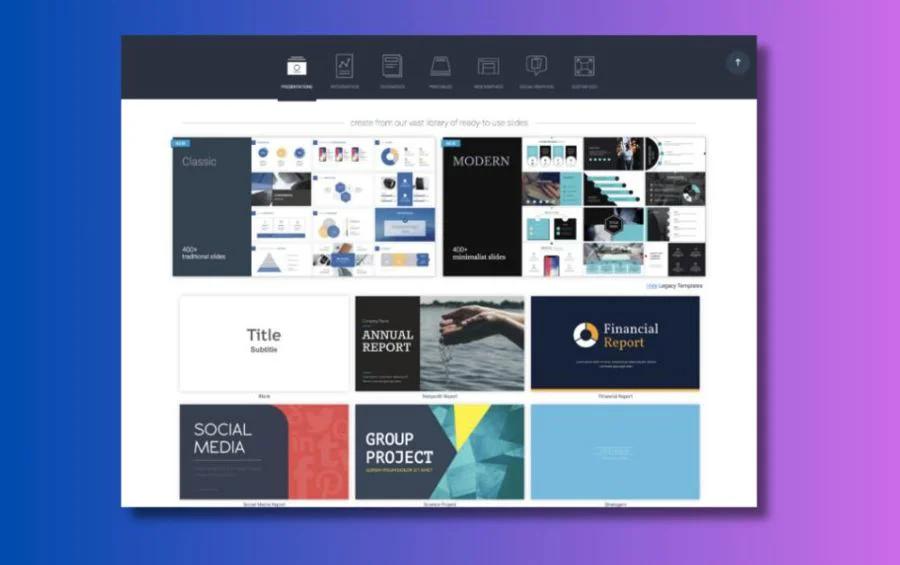
Visme is a design tool for presentations, infographics and reports. Researchers use its templates and chart tools to turn findings into visual stories that people outside the research team will read, such as one-page summaries, infographics and slide decks.
Visme is built for communicating results, not for analyzing data. Interactive dashboards on live data are better suited to a tool like Tableau.
Pricing: Visme has a free Basic plan. Starter costs $12.25 per month and Business $24.75 per person per month, both billed annually, and Enterprise is priced on request from 10 users. Plans are listed on Visme's pricing page.
How to Build Your Market Research Toolkit
Start with the question, not the tools. If you need market sizes and industry figures, begin with Statista. If you need to know how the online side of a market is divided among competitors, Semrush covers that, and if you want to know whether interest in a category is growing, Glimpse shows the trend in search demand.
If you need to ask your own questions, Jotform handles the survey and Prolific supplies the participants. If you need to see how people actually behave in their daily lives, Indeemo is built for that kind of qualitative depth. If your question is what is being said about a brand right now and how widely, Meltwater is the stronger fit.
If you already have thousands of open-ended answers, reviews or support conversations, or want to study a competitor's customers through their public reviews, and you need to know why people feel the way they do with findings that hold up statistically, Kimola is built for that. If your data is a few hundred responses that your team can read and code in an afternoon, you may not need a dedicated analysis tool. To present the results, use Tableau for interactive dashboards and Visme for reports and presentations.
Frequently Asked Questions
What tools do market researchers use?
Most market researchers combine a source of secondary data such as Statista, a survey tool such as Jotform, a way to recruit participants such as Prolific, an analysis tool and a reporting tool such as Tableau or Visme. Qualitative projects add tools like Indeemo, and teams that track brands over time add a social listening platform such as Meltwater.
Are there free market research tools?
Yes. Statista, Glimpse, Jotform, Visme and Kimola all offer free plans, and Tableau offers Tableau Public and a free desktop edition. Free plans have limits on data, features or volume, but they are enough to evaluate each tool on a real project.
What is the difference between social listening and customer feedback analysis?
Social listening tools such as Meltwater monitor what is being said about a brand or topic across media and social platforms, often in real time. Customer feedback analysis tools such as Kimola analyze a set of feedback in depth to explain why people feel the way they do and how that differs between segments. Many teams use both.
Can I research a competitor's customers without running a survey?
Yes. Public reviews on platforms such as Amazon, Trustpilot, Google Play and the App Store are a direct record of what a competitor's customers value and dislike. Kimola can collect these reviews from a product page link and analyze them with the same method used for your own feedback.
Why not just use ChatGPT to analyze research data?
General AI assistants are good at summarizing a small set of responses. Classifying thousands of records consistently, testing whether differences between segments are statistically significant, getting the same result from the same data every time and showing the source behind every figure require a dedicated research infrastructure.
Conclusion
A good market research toolkit follows the steps of a project: secondary data, primary data, context, analysis and reporting. Most teams need only a few of these tools at a time, chosen by the question they are trying to answer. If you want to see how Kimola handles your own customer feedback, you can start on the free Starter plan.