How to Analyze Typeform Survey Data?
Feb 07, 2026 - 12 minute read
Introduction
Hey there! Have you ever felt that your surveys aren't quite hitting the mark with the insightful results you anticipated? You're not alone, and you've come to the right place. Let’s dive into the world of survey data analysis and discover how it can revolutionize your decision-making process.
Picture survey data analysis like perfecting a favorite dish. You have all the ingredients—responses from your audience—but the true flavor comes from how you mix and interpret them to unlock valuable insights. This analysis assists you in identifying patterns and trends, helping you decide your next move, whether it’s improving a product, understanding your audience more deeply, or refining your services.
Why is striving for great survey analysis so crucial? Imagine hosting a successful event, receiving fantastic feedback, but missing out on the details because you didn't jot them down. Just like that, potential insights slip away. Excellent survey analysis ensures you capture every critical detail—like using a magnifying glass to spot the elements that could really set you apart from the competition.
Collecting responses is just the beginning. The true magic lies in analyzing this data to transform it into actionable insights. Why does this matter? Inside those surveys lies a treasure trove of information. When properly analyzed, they can reveal customer preferences, highlight new trends, and pinpoint areas needing improvement. These insights are essential for crafting marketing strategies, steering product development, and enhancing customer service.
So grab your favorite beverage and come along as we explore the art of analyzing Typeform survey data. Together, let's turn those raw responses into strategic actions that deliver real results.
Overview of Typeform
As we prepare to dive into survey data analysis, it's crucial to familiarize ourselves with a tool that has won hearts worldwide—Typeform. This platform transforms traditional surveys into engaging, conversational experiences. Typeform is an online tool designed to create interactive surveys, quizzes, and forms that resemble friendly dialogues rather than rigid interrogations. Its user-friendly interface encourages participants to share their thoughts more openly.

What makes Typeform stand out? For starters, its interactive design ensures a smooth user experience, presenting one question at a time to prevent overwhelming the respondent. This approach mimics an intimate conversation with a good friend who truly listens.
Customization is another hallmark, allowing you to tailor your surveys with colors, fonts, and images to perfectly reflect your brand’s identity. Moreover, Typeform’s ability to integrate seamlessly with other tools, such as Google Sheets, Mailchimp, and Slack, keeps your workflow running smoothly.
Typeform doesn't stop there; its conditional logic feature customizes the survey path based on respondents' previous answers, crafting a personalized journey akin to a compelling narrative.
When it comes to the variety of questions, Typeform offers a rich selection: multiple choice for clear-cut preferences, picture choice for visual input, short and long text for quick or detailed responses, ratings and scales for gauging satisfaction, and Likert scales for measuring attitudes.
Typeform as the Swiss Army knife of survey tools, offering flexibility and versatility to deeply explore respondents’ thoughts. With its vast array of features and question types, Typeform makes survey creation not only seamless but also enjoyable, paving the way for insightful data analysis. Now, let's discover how these surveys can be transformed into actionable insights!
Setting Clear Objectives for Your Survey Analysis
Before diving headfirst into survey analysis, let’s chat about why setting clear objectives is key. Think of it like planning a road trip: without a destination in mind, you might end up driving in circles. By clearly identifying your goals, you ensure that every mile covered brings you closer to meaningful insights.
Identifying Your Goals: What Do You Want to Achieve?
First things first—ask yourself: What are we trying to uncover with this survey? Are you looking to improve a product, understand customer needs, measure satisfaction, or perhaps all of the above? Honing in on specific goals will not only give you clarity but help direct your focus during analysis. Whether it's gathering feedback to enhance a new product line or understanding user experience, being clear about what you want to achieve is the cornerstone of effective survey analysis.
Avoid vague objectives; instead, be specific. Rather than “improving customer satisfaction,” try “understanding why customers prefer competitors.” This specificity guides not only how you structure your survey but also how you interpret the results later on.
Connecting Survey Objectives with Business Goals
The magic happens when survey objectives align with broader business goals. Imagine your company aims to boost customer loyalty—your surveys can be tailored to unearth factors influencing repeat purchases. Crafting surveys that resonate with overarching business strategies ensures that the insights you gather directly contribute to the organization’s success.
Not sure how to connect these dots? Let’s keep it simple: If your business goal is expanding into new markets, your survey objective might focus on identifying unmet needs or local preferences. By aligning the two, you're not just gathering data; you're collecting actionable insights that can effectively steer business decisions.
Remember, the clearer the objectives, the more focused your analysis will be, ensuring your findings are not only insightful but incredibly useful. With well-defined goals in hand, you’re all set to extract valuable insights that are aligned with both your immediate priorities and long-term business aspirations! Ready for the next step? Let's keep moving forward!
Preparing Your Typeform Data for Analysis
With your survey responses in hand, it’s crucial to prepare your Typeform data for analysis to ensure everything is organized and ready for action. Start by exporting your data, which Typeform makes easy by offering formats like CSV and XLS. Simply navigate to the survey’s results section and download your data in your chosen format—CSV is great for most spreadsheet applications, while XLS is ideal for Excel users.
Once your data is exported, the next step is cleaning and organizing it, similar to tidying up a workspace before starting a big project. Raw data can contain duplicates, missing values, or irrelevant entries, all of which need to be addressed. Begin by scanning for errors such as typos and inconsistent responses. Remove any duplicate entries to maintain the integrity of your dataset, and consider setting aside incomplete responses that offer little value.
After cleaning your data, organize it logically by arranging it into categories or themes that align with your analysis objectives. Structuring your data ensures that your analysis process will be smooth and efficient. Though it might seem like an extra step, preparing your data is essential for facilitating insightful analysis. With your data now clean and organized, you're ready to dive into analysis and uncover the valuable insights it holds. Let’s move forward and discover what your data can reveal!
Choosing the Right Analytical Techniques
With your data clean and ready, it’s time to dive into the analysis, but choosing the right techniques is key to unlocking valuable insights. Let's start with understanding the difference between quantitativeand qualitativeanalysis—think of quantitative as a detailed map full of numbers and statistics, perfect for measuring trends and patterns. This is your go-to if you've asked questions like "How satisfied are you with our product on a scale of 1 to 10?". On the other hand, qualitative analysis is akin to a vivid photograph, focused on the nuance in open-ended responses to understand the "why" behind customer experiences, ideal for capturing rich and detailed stories.
For numerical data, statistical methods come into play to unravel the story within the numbers. Use techniques like mean, median, and mode for summarizing data, or dive into correlation and regression to discover relationships between variables. Cross-tabulations can offer a deeper glimpse into comparisons across different demographics, much like using a magnifying glass to see interactions among various factors.
Visualization is another crucial aspect, as it transforms raw data into an accessible visual story. Charts and graphs make it easier to compare, understand, and share insights. Bar charts can compare quantities, pie charts illustrate proportions, and line graphs depict trends. You don't need to be a graphic expert; tools like Excel, Google Sheets, and Tableau simplify the process of creating effective visual representations.
By choosing the right mix of analytical techniques and visualizing data effectively, you can turn survey results into actionable insights that drive informed decision-making. Now, it’s your turn to discover what your data has in store!
Leveraging Advanced Tools for Deeper Insights
As you dive deeper into survey analysis, embracing advanced tools can remarkably enhance your insights. AI and machine learning tools act like personal assistants, swiftly navigating immense data landscapes to detect patterns and bring hidden trends to light. They streamline the analysis process, making it faster and more precise, allowing you to focus on strategic decisions rather than the minutiae of data handling.
These technologies are specifically adept at processing qualitative data, transforming open-ended responses into actionable insights. Here’s where Kimola’s technology excels in analyzing your Typeform open-ended survey responses. As a Kimola member, you can effortlessly drag and drop your Excel data into the platform, selecting the relevant columns for responses and dates.
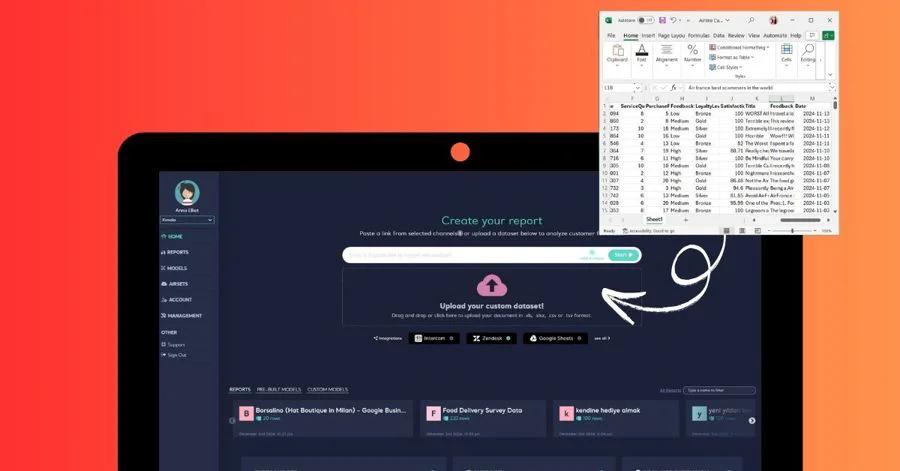
The real magic unfolds as you choose your area of interpretation—be it buyer personas, positive and negative angles, insights, or marketing recommendations. An executive summary accompanies each analysis, providing a snapshot of findings with minimal effort. Select your report language and enable multi-label analysis, where Kimola’s intuitive platform comprehends data context without pre-training, forming clusters and classifying data accordingly.
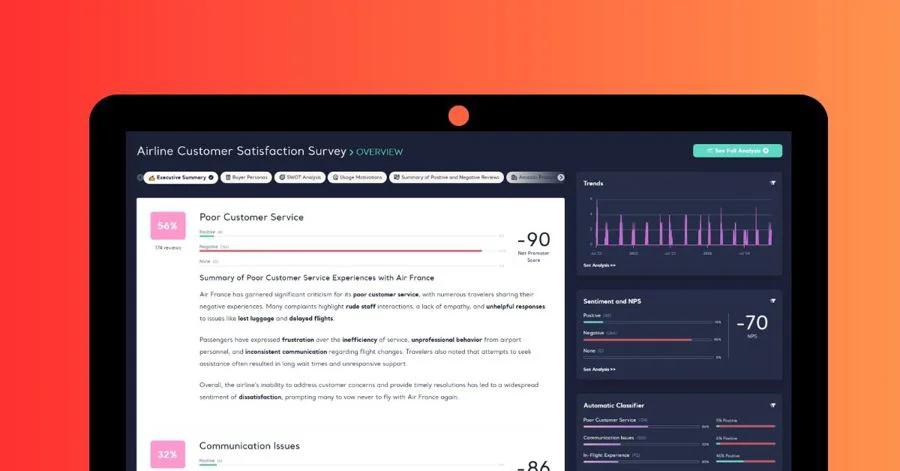
Survey responses often encompass multiple topics, and Kimola’s multi-label classification shines here, assigning multiple labels to each response. This allows you to dive deeply into sentiment analysis for each label with aspect-based sentiment insights. Another standout feature of Kimola is its reporting prowess. You can generate comprehensive reports in PDF and PPT formats, encapsulating themes, sentiment analysis, and interpretations.
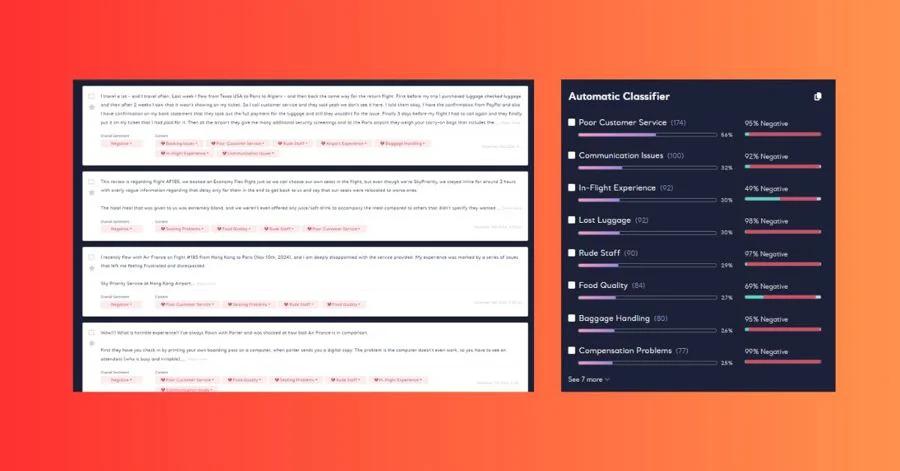
By leveraging this advanced tool, you transform your data into a strategic asset, unlocking powerful insights to guide your decision-making.
Common Pitfalls in Survey Data Analysis
As you embark on turning your survey data into actionable insights, it’s important to navigate around some common pitfalls that could steer your analysis off course. Let’s talk about avoiding bias in your interpretations and ensuring privacy and ethics in data handling to keep your findings reliable and secure.
Avoiding Bias in Your Interpretations
We all have biases—it’s part of being human. However, letting them seep into your data analysis can skew results and lead to inaccurate conclusions. To keep bias at bay, start by examining your initial assumptions and keep an open mind throughout the process.
Consider employing a diverse team to analyze your data; fresh perspectives can highlight potential blind spots you might miss on your own. Additionally, relying on statistical methods and established analytical frameworks can help ensure your findings are grounded in the data, rather than preconceived notions. It’s all about letting the data speak for itself, rather than interpreting results that align with expectations.
Ensuring Privacy and Ethics in Data Handling
Handling data with care is not just important—it’s a necessity. Ensuring privacy and adhering to ethical standards protects your respondents and builds trust. Make certain that any personally identifiable information is anonymized before you begin your analysis. This step helps shield your respondents' identities while still allowing you to glean useful insights.
Be transparent about how data will be used. If possible, obtain explicit consent from participants to reassure them about your intentions. Familiarize yourself with relevant data protection regulations, such as GDPR or CCPA, to ensure compliance and uphold ethical standards in your data practices.
By keeping bias out of your interpretations and prioritizing privacy and ethics, you lay a solid foundation for trustworthy and credible data analysis. Navigating these common pitfalls will not only improve the quality of your insights but also enhance the integrity of your overall research process. Let’s keep the momentum going and continue unraveling the stories within your data!
Conclusion
As we wrap up our journey through the intricacies of analyzing Typeform survey data, remember that insightful analysis is about more than just crunching numbers—it’s about turning raw responses into meaningful, strategic actions that drive your business forward.
We started by understanding what survey data analysis entails and setting clear objectives to ensure your efforts align with your business goals. From there, we explored the features of Typeform, emphasizing the tool’s ability to make the survey experience both engaging and effective.
Preparing your data was next, with tips on exporting, cleaning, and organizing it to set the stage for smooth analysis. We also discussed choosing the right analytical techniques, whether diving into quantitative data or exploring the nuances of qualitative insights, making use of visualization tools to bring clarity to your findings.
By leveraging advanced tools like AI and machine learning, with Kimola’s innovative technology, you can enhance your analysis and extract deeper insights from open-ended responses—turning your data into powerful strategic assets.
We addressed common pitfalls, such as avoiding bias and ensuring privacy and ethics, to maintain the integrity and credibility of your findings. By keeping these considerations in mind, you ensure your analysis is thorough, responsible, and actionable.
Now it’s your turn to apply these insights to your own surveys. As you delve into your data, remember that each response holds the potential to reveal valuable stories about your customers and your market landscape. Armed with this knowledge, you're prepared to make informed decisions that will shape the future of your business.
Thank you for joining us on this exploration of Typeform survey data analysis. We hope you feel equipped and inspired to unlock the full potential of your surveys! Remember, your data has a story to tell—are you ready to listen?
