How to Analyze Jotform Survey Data?
Feb 07, 2026 - 14 minute read
Introduction
In the era of data-driven decision-making, survey data analysis has emerged as a vital tool for businesses, researchers, and organizations striving to understand and respond to their audiences. Whether you're collecting feedback on a new product, evaluating customer satisfaction, or conducting academic research, the insights garnered from survey data can guide strategies, improve offerings, and enhance overall operational effectiveness.
At the heart of many successful survey initiatives lies Jotform, a widely acclaimed online survey tool known for its user-friendly interface and robust set of features. Jotform empowers users to create fully customized surveys with ease, allowing for quick deployment and efficient collection of valuable feedback. Its popularity is further bolstered by its flexibility, enabling users of all technical levels to design surveys that meet their specific needs without requiring extensive programming knowledge.
The purpose of this guide is to take you through the entire process of analyzing Jotform survey data. From setting up your survey correctly and exporting data, to choosing the right analysis methods and turning findings into actionable insights, this guide provides a comprehensive roadmap. Whether you're new to survey data analysis or seeking to refine your skills, we aim to equip you with the knowledge needed to maximize the value of your survey data and inform strategic decisions with clarity and precision. So, let’s embark on this journey to unlock the power of your Jotform survey data!
Understanding Jotform and Its Features
What is Jotform?

Imagine having a magical toolbox that allows you to seamlessly gather insights from your customers, employees, or even seminar attendees, all without grappling with complicated software. That's Jotform for you – a versatile and user-friendly online form builder that takes the hassle out of survey creation. Since its inception, Jotform has become a go-to choice for millions of users worldwide, from small businesses and freelancers to educators and large enterprises, and it's easy to see why.
So, what makes Jotform stand out in the crowded field of survey tools? For starters, it offers an incredibly intuitive drag-and-drop interface. Even if you're not tech-savvy, you can effortlessly create aesthetically pleasing and professional forms that capture all the data you need. Need a form for customer feedback? A registration form for an event? Or perhaps a detailed survey for academic research? Jotform's got you covered, with hundreds of pre-designed templates that can be customized to fit your specific requirements.
One of Jotform's standout features is its comprehensive integration capabilities. It plays well with other tools you might already be using, like Google Sheets, Slack, or PayPal, making data collection and management part of a smooth, cohesive workflow rather than a series of disjointed tasks. Moreover, Jotform's advanced conditional logic feature automatically tailors questions based on previous responses, ensuring that surveys remain relevant and engaging for respondents.
And let's not forget about security. With Jotform, your data is protected by top-notch security measures, including GDPR compliance and SSL encryption. This means the sensitive information you collect is safeguarded at every step.
In essence, Jotform is more than just a survey tool – it’s a comprehensive platform that turns your data-gathering dreams into reality, all while ensuring a seamless journey from form creation to data collection. Whether you're conducting a simple feedback survey or a complex market research project, Jotform makes the process feel like a breeze. Ready to dive deeper into the world of survey data analysis with Jotform? Let's move on!
Setting Up Your Survey Properly
Once you've got a handle on what Jotform can do, it's time to channel that power into setting up your survey properly. Like a well-oiled machine, a thoughtfully designed survey can significantly enhance the quality and precision of the data you collect. Here are some tips and considerations to ensure your survey is not just good, but great.
Crafting Clear and Concise Questions:
The essence of an effective survey is in its questions. Clear, concise, and direct questions are your best allies in obtaining useful feedback. Avoid jargon or technical terms that might confuse respondents. Instead, keep it simple. For example, instead of asking, "What is your overall assessment of our customer service interaction efficiency?" you could say, "How would you rate our customer service?" The goal is to make sure every respondent, regardless of their background, can easily understand what's being asked.
Establishing a Logical Flow:
Think of your survey as a conversation – it should flow naturally from start to finish. Begin with broader questions that set the stage, and then gradually shift to more specific ones. This logical progression keeps respondents engaged and makes it easier for them to provide thoughtful answers. Jotform’s ability to arrange questions through a drag-and-drop interface makes adjusting your survey’s flow both intuitive and painless.
Leveraging Jotform’s Conditional Logic:
Take advantage of Jotform’s conditional logic feature, which allows questions to adapt based on previous responses. This dynamic approach not only shortens the survey (a major plus in maintaining engagement) but also ensures respondents are only answering questions pertinent to them. For instance, if a respondent indicates they haven’t used a new product feature, there’s no need to ask them to rate it.
Keeping It Brief but Comprehensive:
The length of your survey can make or break its success. Aim for brevity while ensuring you cover all necessary topics. Respondents are more likely to complete a survey if it’s concise, and less likely to drop out midway. Consider what information is essential and trim any superfluous content that doesn’t directly contribute to your main objectives.
Providing a Clear Purpose:
Communicate the purpose of the survey upfront. Let your respondents know why you're collecting this data and how it will be used. This transparency fosters trust and encourages honest, thoughtful responses.
Testing Your Survey:
Before sending out your survey, test it extensively. Check for clarity, functionality, and flow. Even the smallest typo or a misplaced question can disrupt the user experience. Conduct a pilot survey with a small group to gather feedback and make necessary adjustments.
By setting up your survey properly with these tips in mind, you'll be in a strong position to collect meaningful, actionable data. Jotform provides all the tools you need to create an engaging, clear, and purposeful survey – now it's up to you to wield them effectively! Ready to dive into analyzing your data? Let's get started!
Preparing Your Survey Data for Analysis
Exporting Data from Jotform
You've crafted a thoughtful survey, distributed it to your audience, and now the responses are rolling in. The next exciting step is preparing your survey data for analysis, starting with exporting it from Jotform. The process is straightforward, and I'll walk you through it step by step:
Step-by-Step Guide on How to Export Survey Data:
1. Login and Access Your Survey: First, head over to Jotform and log into your account. Once you’re in, navigate to the 'My Forms' section. Here, you'll find a list of all the forms you've created. Select the survey you wish to export data from.
2. Go to Submissions: Click on the ‘More’ dropdown next to your selected form. From there, click on ‘Submissions’. This will take you to the submissions page, where you can view all the responses collected.
3. Choose Your Export Options: On the submissions page, you'll see an option for 'Download'. Clicking this will present you with a choice of formats to export your data. Jotform allows you to export in several common formats as CSV, Excel and PDF.
4. Export Your Data: Once you’ve decided on a format, click on your chosen option. If you're exporting in CSV or Excel, Jotform will generate a file that you can download directly to your computer.
Formats Recommended for Analysis:
For most data analysis purposes, exporting your data in CSV or Excel is recommended. These formats are universally compatible with data analysis tools and are easy to manipulate. If you're planning on using visualization software or statistical programs like R or Python, CSV is particularly useful due to its simplicity and ease of importing.
With your data exported and ready, you're well on your way to transforming raw survey responses into valuable insights. The next step? Cleaning and organizing your data to ensure it's analysis-ready. Let's dive into that next segment!
Cleaning and Organizing Your Data
Congratulations on successfully exporting your survey data from Jotform! Now, it's time to roll up your sleeves and dive into the crucial task of cleaning and organizing your data. Think of this step as tidying up before a big event; it sets the stage for a seamless and effective analysis. Let me guide you through why it matters and how you can do it efficiently.
The Importance of Data Cleaning
Imagine trying to understand a book where every page is printed in random order with lots of typos – frustrating, right? That’s exactly what performing analysis on unclean data feels like. Cleaning your data is essential because it:
1. Eliminates Errors: Whether it’s duplicate entries, typos, or inconsistent formats, errors can skew your results and lead to inaccurate conclusions.
2. Enhances Accuracy: Clean data ensures that your analysis reflects reality accurately, leading to insights you can trust and act upon.
3. Saves Time: Addressing issues upfront prevents you from having to backtrack later, streamlining the entire analysis process.
Choosing the Right Analysis Method
Quantitative Analysis Techniques
When you've successfully prepared your survey data, the next logical step is quantitative analysis. This process uses statistical methods to transform your numerical data into meaningful insights. It's about identifying trends, patterns, and relationships within the data collected, providing a data-driven foundation for decision-making.
In general, quantitative analysis encompasses a variety of statistical methods. Descriptive statistics, for instance, offer a basic summary of the data through figures like averages (mean), medians, and modes – these help provide a snapshot of the typical responses within your dataset. Inferential statistics, on the other hand, allow you to make predictions or broader generalizations about a larger population based on your sample data. Techniques such as regression analysis or hypothesis testing are often used here.
Applying basic statistical tests is a key part of this analysis. T-tests are frequently employed to compare means between two groups, such as evaluating customer satisfaction levels before and after a product update. Chi-Square tests are ideal for categorical data, helping to explore relationships between different categories, like understanding if satisfaction varies by demographic factors. For comparisons across multiple groups, ANOVA (Analysis of Variance) can be used to see if different groups react differently to a survey item.
The chosen statistical method largely depends on the specific goals of your survey and the nature of the questions you’re exploring. By employing these quantitative techniques, you reveal layers of information that can drive strategic decisions and enhance understanding of your audience. Once these methods are applied, you're equipped with the insights needed to inform your next steps effectively. Next, you can complement these findings with qualitative analysis to gain even richer perspectives.
Qualitative Analysis Techniques
While numbers provide valuable insights, the true depth of understanding often comes from the words shared by your respondents in open-ended survey questions. Qualitative analysis delves into this narrative data to uncover deeper insights, allowing you to grasp the emotions, motivations, and experiences that complement the hard data.
Analyzing open-ended responses is akin to being a detective, piecing together clues to form a bigger picture. One common technique is coding, where you assign labels or codes to different segments of text. This helps organize the data so that patterns and trends become more evident. By starting with a thorough reading of responses, you can identify common themes and mark recurring words or phrases for easy comparison.
Another effective method is content analysis, which systematically examines the frequency and presence of specific ideas or words. This approach is particularly helpful when dealing with a large volume of responses, as it allows you to quantify the common themes for a more structured interpretation.
Central to qualitative research is thematic analysis, a technique that invites a creative exploration of your data by identifying, analyzing, and interpreting patterns or themes within it. These themes reveal shared trends or concerns among respondents, offering insights that quantitative data might not capture. It's not just about identifying frequent mentions but also understanding the context, tone, and underlying meanings in the responses. The process often involves iterative refinement to ensure the themes accurately reflect respondents’ perspectives.
Incorporating thematic analysis into your approach enriches your overall findings, adding layers of understanding. It’s like coloring in a detailed sketch, enhancing your grasp of respondents’ experiences and viewpoints. By combining these qualitative techniques with quantitative analysis, you create a comprehensive picture of your survey results, allowing for a more holistic interpretation of the data.
Using Kimola for Advanced Analysis
In our tech-driven world, leveraging artificial intelligence (AI) for data analysis is akin to harnessing rocket fuel for your insights journey. Welcome to Kimola, where the power of AI transforms your survey feedback into rich, actionable insights with efficiency and ease.
If you're ready to dive deeper into your data, getting started with Kimola is a breeze. After signing up for Kimola, the process is as straightforward as it gets. Simply drag and drop your Excel data, exported from Jotform, into the platform. Here, you’ll specify the column containing those valuable open-ended responses and mark the date column if applicable. From there, Kimola takes the wheel, using AI-driven interpretations to dissect your data.
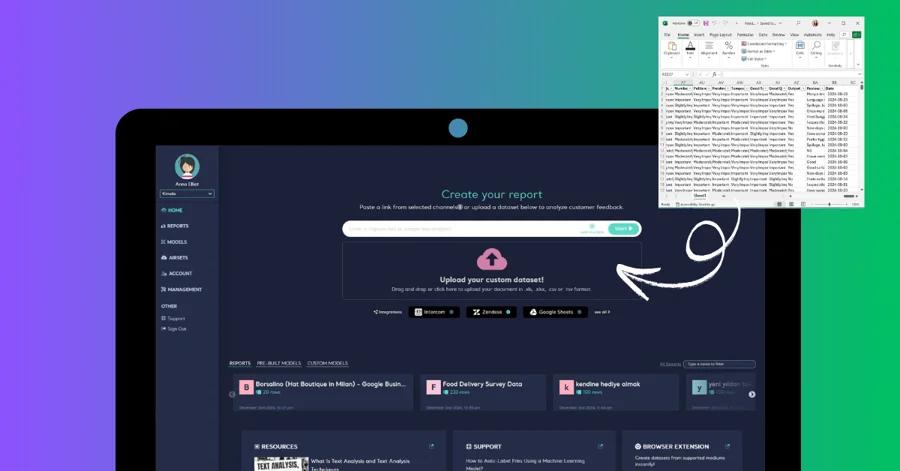
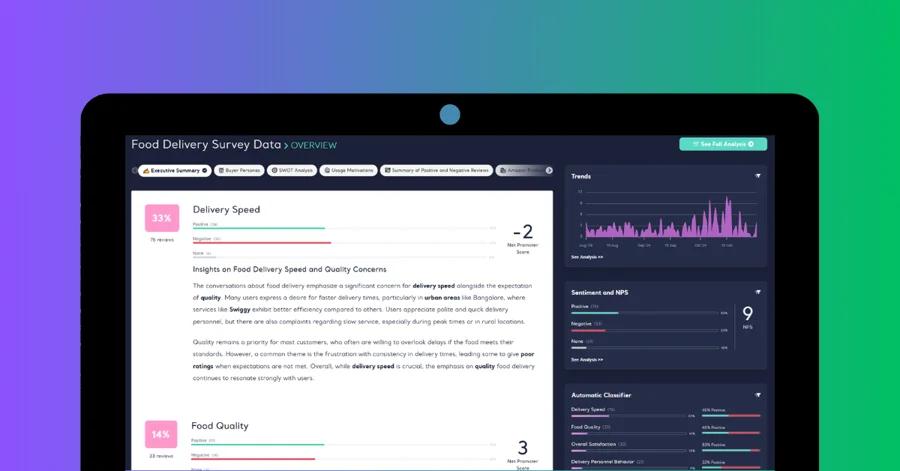
Kimola offers a wealth of interpretation options, allowing you to explore various facets of your data. Whether you're interested in crafting detailed buyer personas, analyzing feedback for positive and negative angles, or gathering actionable marketing recommendations, Kimola delivers these insights with precision. The platform does the heavy lifting, summarizing findings into an executive summary that comes bundled with your analysis, saving you time and effort.
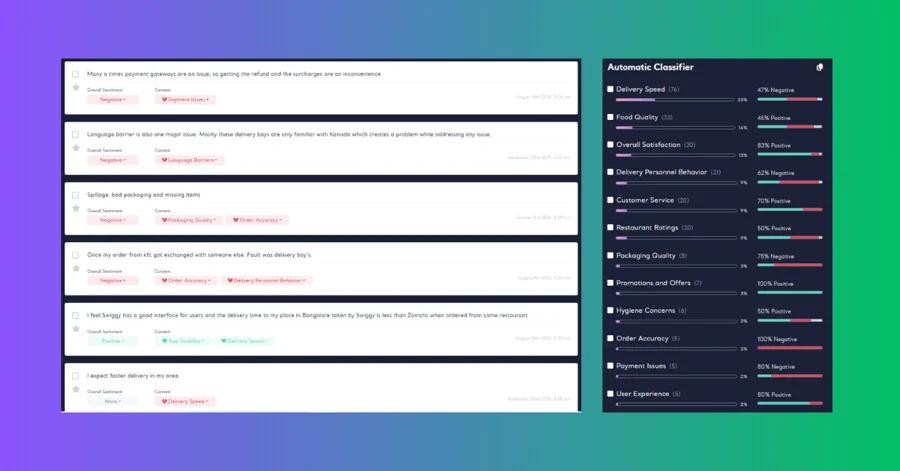
Choosing the right language for your report and opting for multi-label analysis allows Kimola to excel even further. This advanced feature lets Kimola understand the context without requiring prior data training, creating clusters based on the intricacies of your feedback. Recognizing that customer responses often span multiple topics, Kimola's multi-label classification technology adeptly assigns multiple labels to each response. This ensures that you're not only capturing all aspects of the feedback but also delving deep into aspect-based sentiment analysis for each label, offering rich insights into how your audience truly feels.
One of Kimola's standout features is its comprehensive reporting options. The platform allows you to print all outputs from the analysis, including thematic insights, sentiment analysis, and interpretations, in formats that suit your needs best – whether that’s a PDF, PowerPoint presentation, or an Excel report. This flexibility ensures that you can share and present insights seamlessly across your team or stakeholders.
Harnessing Kimola means transforming survey analysis from a task into an insightful journey, revealing the hidden stories within your data and arming you with the knowledge needed to make informed, strategic decisions.
Conclusion
Analyzing Jotform survey data is not just about reckoning numbers; it's about extracting meaningful insights that can inform and transform your strategies. We began our journey by understanding the importance of setting up your survey correctly, ensuring questions are clear and the flow is logical. Next, we moved through exporting your data and preparing it thoroughly by cleaning and organizing it with precision.
Our exploration of quantitative and qualitative analysis techniques provided you with tools to dissect your data, uncovering the trends hidden in numbers and the narratives shared through words. Leveraging the advanced capabilities of Kimola, we’ve amplified our analysis, turning raw feedback into actionable insights with AI-driven prowess.
The benefits of a comprehensive data analysis are substantial – from understanding customer sentiments and motivations to driving more strategic decisions and improving offerings. You've equipped yourself with the knowledge to harness your survey data's full potential; now it's time to put these insights into action.
Ready to transform your survey data into strategic wins? Dive into Kimola today and experience the power of enhanced analysis firsthand.


