Create a Report with an Airset
3 mins read - Updated on Nov 03, 2025After collecting data with the Airset Generator, you can create a report directly on your Kimola Dashboard. Reports turn your collected reviews, comments, or feedback into insights using Kimola’s AI models and optional interpretations.
An Airset is a dataset automatically created when you collect data using the Airset Generator, Kimola’s browser extension available on the Chrome Web Store. It allows you to scrape reviews or comments from supported platforms such as Amazon, Trustpilot, or Google Play Store and send them directly to your Kimola Dashboard for analysis.
If you haven’t set up the Airset Generator yet, learn how to install and connect it by following the Set up the Airset Browser Extension guide. Once your extension is ready, every dataset you scrape will appear under Datasets → Airsets in your Kimola Dashboard — ready to be turned into a report.
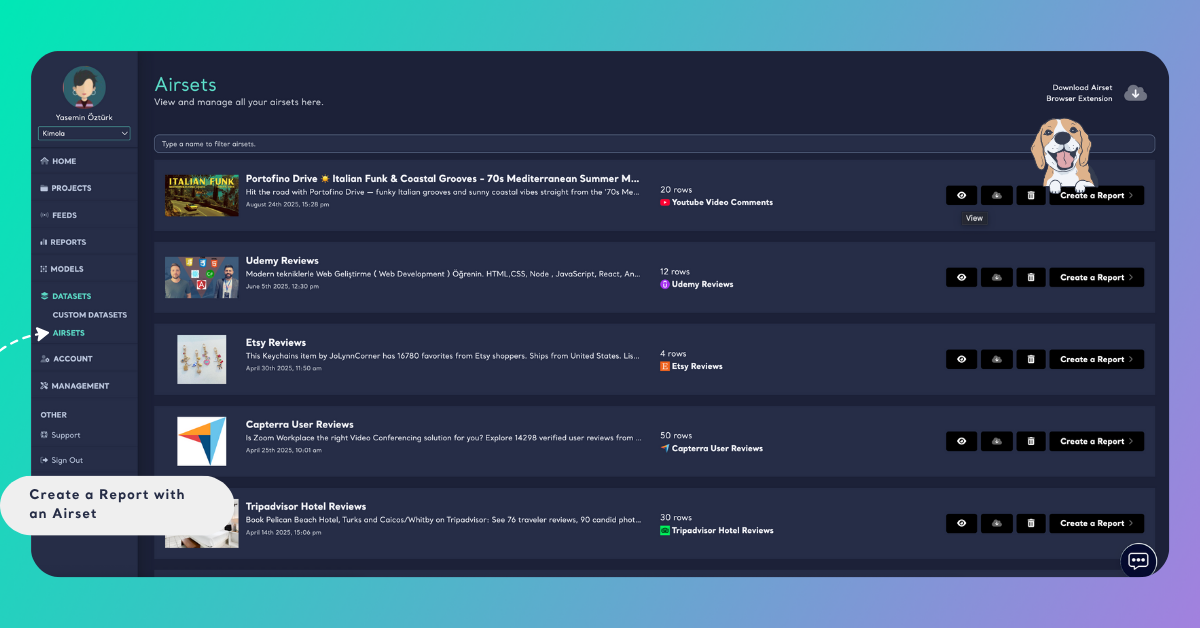
To create a report, sign in to your Kimola Dashboard. From the left menu, click Datasets, then open the Airsets tab. Find the dataset you want to analyze and click Create a Report.
Step 1: Select Dataset Columns
The first step shows a preview of your dataset. Before you proceed, choose the correct columns for analysis.
Each dataset may include the following columns:
- Text Column (Required): The column that holds the text content to analyze.
- URL Column (Optional): The column that holds the original link of the review or comment.
- Date Column (Optional): The column that includes the creation date of each entry.
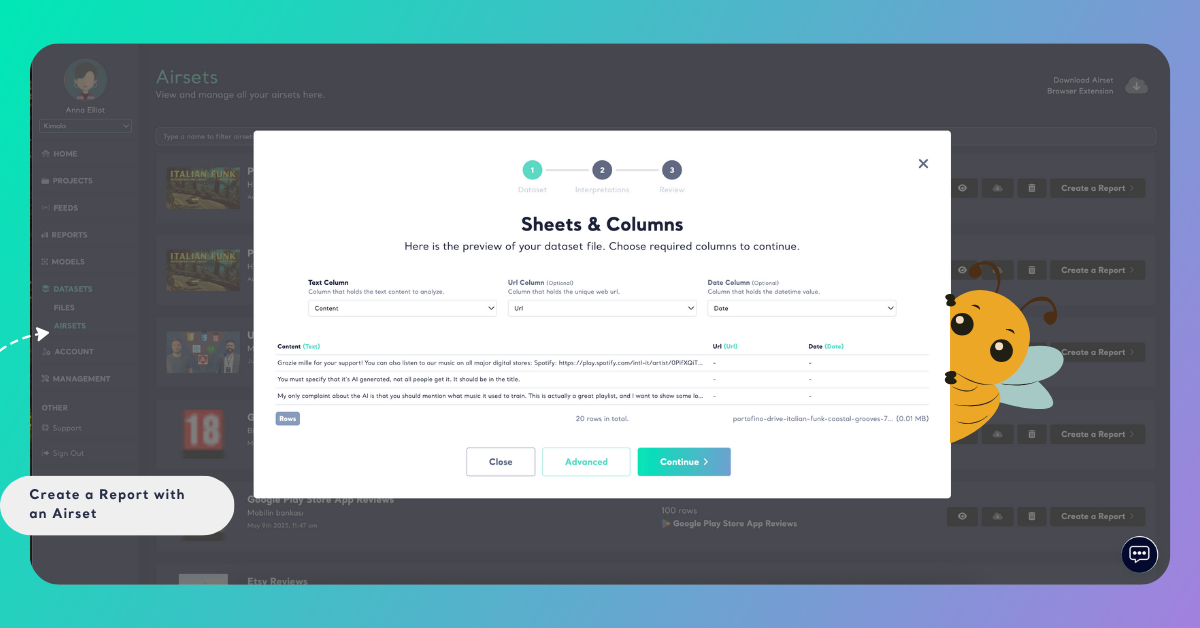
Click Continue to move to the next step.
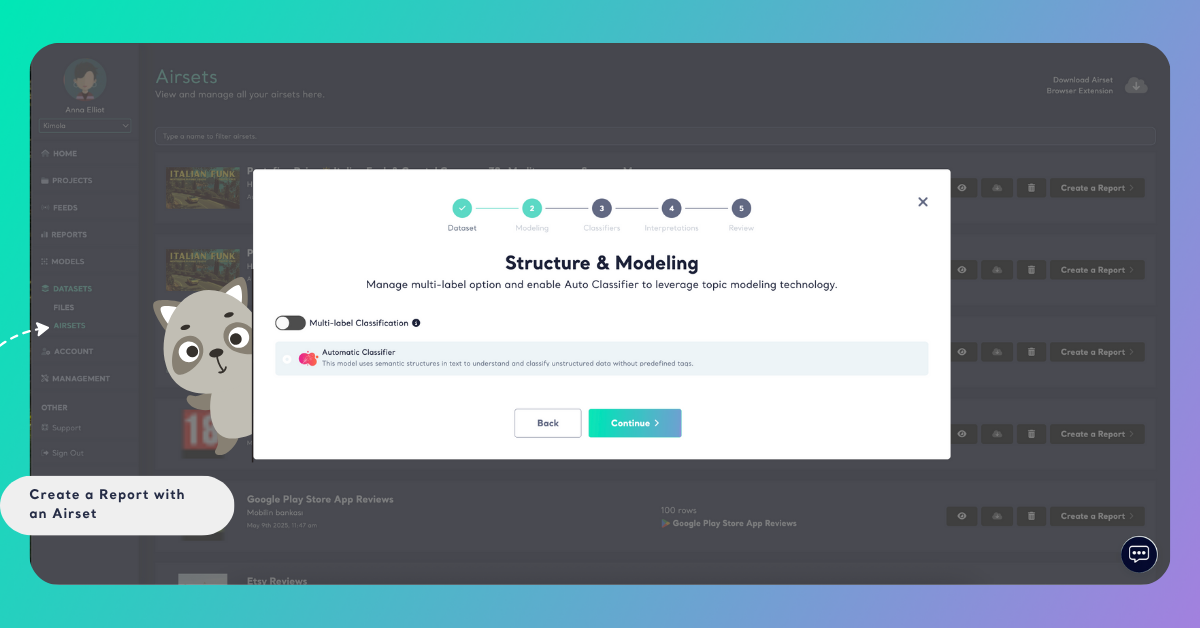
If you do not want to analyze your dataset with Multi-Label and Automatic Classifier options, click Advanced to disable these settings and continue. In this mode, the next step — Classifier — allows you to select either a custom or a pre-built model for your analysis. The Multi-Label option enables each record to belong to more than one category (for example, a comment can be tagged as both Delivery and Pricing), while the Automatic Classifier automatically selects the most suitable pre-trained model for your dataset type.
Step 2: Choose Interpretations
Interpretations help you analyze customer feedback with a research-driven approach.
You can select one or more depending on the purpose of your report.
Some of the available interpretations include:
- Executive Summary – Provides an overall summary of the main findings, highlighting key insights from your dataset.
- Customer Personas – Identify and segment customer types based on behaviors, needs, and attitudes.
- Usage Motivations – Discover why customers choose your product or service.
- Pain Points – Detect recurring customer complaints or issues.
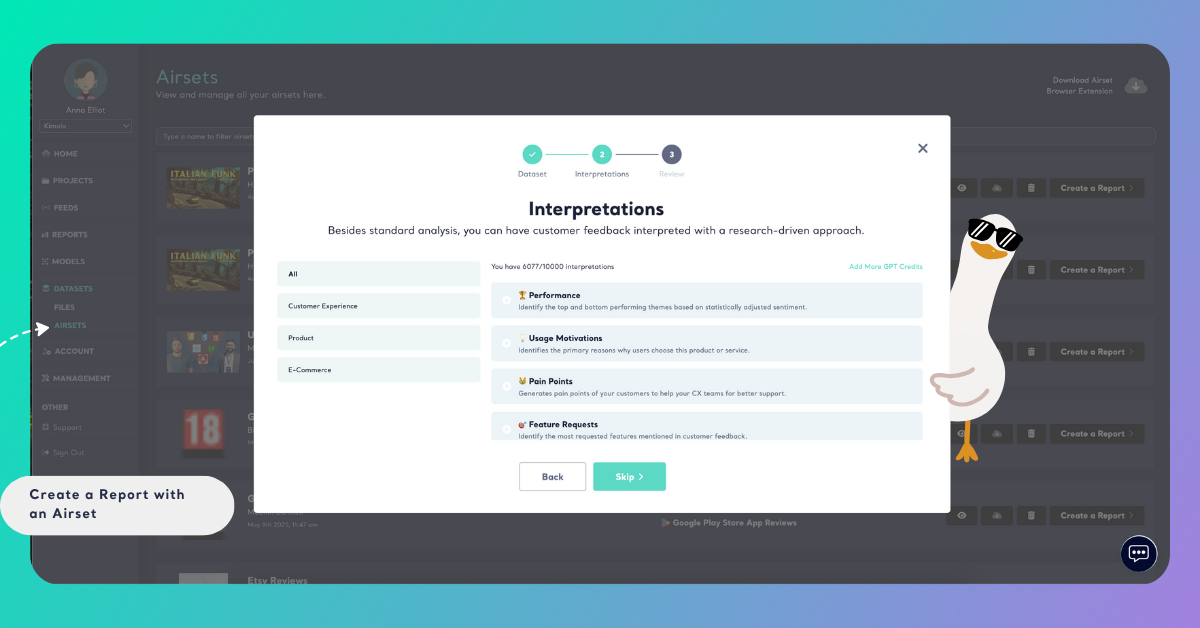
Click Skip if you want to continue without adding an interpretation.
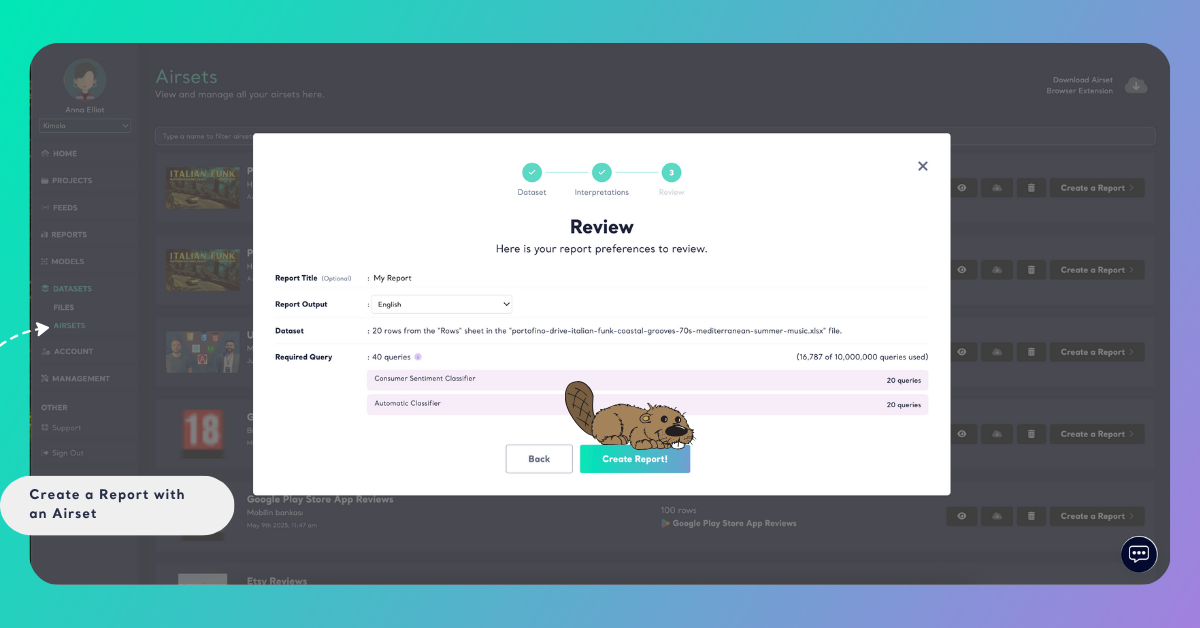
Step 3: Review and Create Report
In the final step, review your report details before creating it. Give your report a clear and descriptive title, select the output language, and check the dataset information shown on this screen. You’ll see how many rows will be analyzed and how many queries will be required for processing. The Required Query section shows how many query credits your report will consume based on the size of your dataset and the selected interpretations.
Once you’ve confirmed that everything looks correct, click Create Report to begin the analysis. Your report will start processing in the background and will appear in the Reports section once it’s ready.