Research Reports
-
 Glowco's CalmCarry Device: An In-Depth Customer Feedback Report
 Trustpilot Reviews
Explore mixed reviews on Glowco's CalmCarry device with our comprehensive analysis on customer experiences.
-
 Explore COSYTRIP Tire Inflator Insights: A Must-Read Report
 Amazon Product Reviews
Discover the COSYTRIP Tire Inflator's prowess through customer feedback. Find out why it's a must-have for car owners.
-
 Unveil the Truth: COOKER KING Frying Pan Feedback Analysis
Amazon Product Reviews
Unveil the Truth: COOKER KING Frying Pan Feedback Analysis
Amazon Product Reviews
Discover the pros and cons of COOKER KING Frying Pans with our comprehensive feedback analysis. Make an informed choice.
-
 Unveil the Truth: Kamylorus PS5 Controller Feedback Analysis
Amazon Product Reviews
Unveil the Truth: Kamylorus PS5 Controller Feedback Analysis
Amazon Product Reviews
Insightful Kamylorus Wireless Controller for PS5 customer feedback analysis. Discover quality, performance, and value insights.
-
 Uncover the Truth Behind Polar Haircare's Hair Dye Shampoo Reviews
Amazon Product Reviews
Uncover the Truth Behind Polar Haircare's Hair Dye Shampoo Reviews
Amazon Product Reviews
Explore our in-depth analysis of Polar Haircare's Hair Dye Shampoo reviews for informed purchasing decisions.
-
 Unveil the Truth Behind YANIBEST Silk Bonnet Reviews
Amazon Product Reviews
Unveil the Truth Behind YANIBEST Silk Bonnet Reviews
Amazon Product Reviews
Explore insights from our YANIBEST Silk Bonnet feedback analysis. Uncover user opinions on quality, size, and comfort.
-
 Uncover Truth Behind Captcha Entry App Reviews
Google Play Reviews
Dive into user feedback on Captcha Entry App with our analysis report covering payment issues and app reliability.
-
 ExtraPe App Review Analysis: Unlock Affiliate Earnings Insights
Uncover the truth behind ExtraPe: Affiliate Marketing app with our in-depth customer feedback analysis.
-
 Unlock Insights: Kashbean Loan App User Feedback Report
Explore user feedback on Kashbean Loan App with our in-depth analysis. Discover pros, cons, and more for informed decisions.
-
 ETAS Travel Scam Exposed: Detailed Customer Feedback Analysis
Trustpilot Reviews
ETAS Travel Scam Exposed: Detailed Customer Feedback Analysis
Trustpilot Reviews
Expose on ETAS Travel's visa scams with customer feedback analysis. Essential for avoiding fraud and safeguarding data.
-
 Tim Hortons App Review Analysis: Unveil User Insights
 App Store Reviews
Uncover the critical flaws in the Tim Hortons app with our in-depth review analysis. Drive improvements and customer satisfaction.
-
 Ludo King® Feedback Analysis: Insights on Gameplay Fairness
Uncover player insights on Ludo King® with our comprehensive report analyzing feedback on fairness, ads, and gameplay.
-
 Transform Your Trading Strategy with Our Exclusive Report
Trustpilot Reviews
Transform Your Trading Strategy with Our Exclusive Report
Trustpilot Reviews
Discover how Low Stress Trading transforms options trading with our comprehensive feedback analysis report.
-
 Unveil Taskbucks' Real User Experiences with Our Report
Uncover the truth behind Taskbucks with our in-depth customer feedback analysis report. Essential insights for businesses.
-
 Uncover the Truth About NIIMBOT Label Maker Reviews
App Store Reviews
Uncover the Truth About NIIMBOT Label Maker Reviews
App Store Reviews
Explore the mixed reviews of NIIMBOT Label Maker with insights on subscription issues, usability, and more.
-
 Uncover the Truth: SAMSUNG Q800F Soundbar Customer Insights
Amazon Product Reviews
Uncover the Truth: SAMSUNG Q800F Soundbar Customer Insights
Amazon Product Reviews
In-depth analysis of SAMSUNG Q800F Soundbar: Discover the balance between immersive sound quality and reliability issues.
-
 Uncover the Truth: SimplyVital Anti-Aging Cream Reviewed
Amazon Product Reviews
Uncover the Truth: SimplyVital Anti-Aging Cream Reviewed
Amazon Product Reviews
Explore the mixed customer feedback on SimplyVital's Anti-Aging Cream with our comprehensive analysis report.
-
 In-Depth Amazon Echo Dot Feedback Analysis: Insights & Trends
Amazon Product Reviews
In-Depth Amazon Echo Dot Feedback Analysis: Insights & Trends
Amazon Product Reviews
Explore the detailed pros and cons of the Amazon Echo Dot from real users - insight for smart home enthusiasts.
-
 Primal Herbs Volume: Transformative User Feedback Insights
Trustpilot Reviews
Primal Herbs Volume: Transformative User Feedback Insights
Trustpilot Reviews
Explore how Primal Herbs' Volume boosts energy and performance with positive user reviews. Perfect for enhancing sexual health naturally.
-
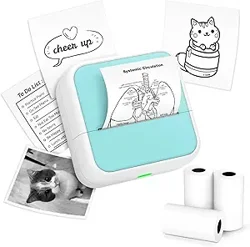 In-Depth Analysis: Printpods Mini Printer Reviews
Amazon Product Reviews
In-Depth Analysis: Printpods Mini Printer Reviews
Amazon Product Reviews
Explore the mixed reviews of the Printpods Mini Printer with our in-depth analysis on print quality, usability, and more.
-
 Unlock Credit Success with Oolka App: Comprehensive Feedback Report
Discover how Oolka app enhances credit management & earns user praise. Get insights from our detailed feedback analysis report.
-
 Unveil the Truth Behind Winedrops: Customer Feedback Analysis
Trustpilot Reviews
Unveil the Truth Behind Winedrops: Customer Feedback Analysis
Trustpilot Reviews
Explore our comprehensive feedback analysis of Winedrops, covering wine quality, customer service, and subscription issues.
-
 Co–Star App Review Analysis: Unveiling User Insights
App Store Reviews
Co–Star App Review Analysis: Unveiling User Insights
App Store Reviews
Explore the dual-edged reviews of Co–Star App with insights on user experiences, pricing concerns, and more.
-
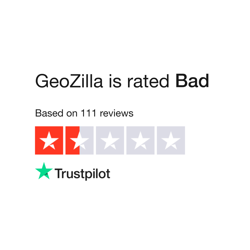 GeoZilla Exposed: Insightful Customer Feedback Analysis
Trustpilot Reviews
GeoZilla Exposed: Insightful Customer Feedback Analysis
Trustpilot Reviews
Uncover the truth with our in-depth analysis of GeoZilla customer feedback, exposing scams and service issues.
-
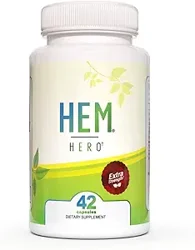 Uncover the Truth: Hem Hero Hemorrhoid Treatment Review Analysis
Amazon Product Reviews
Uncover the Truth: Hem Hero Hemorrhoid Treatment Review Analysis
Amazon Product Reviews
Insightful analysis of Hem Hero Extra Strength Hemorrhoid Treatment reviews. Learn about its effectiveness, price & more.