Pivot Tables in Reports
3 mins read - Created on Feb 26, 2025Dive into the dynamic world of data manipulation with pivot tables—a powerful tool that breathes life into dry datasets by transforming them into interactive summaries. If you've ever wished to explore your data from various angles and make meaningful comparisons, pivot tables are your go-to solution. In this article, we'll guide you through the benefits of using pivot tables and provide a step-by-step guide on how to access and create them within your Kimola reports. Get ready to pivot your way to insightful and compelling data stories!
What Do Pivot Tables Do?
Pivot tables are more than just tables—they're a quick and efficient way to arrange, filter, and summarize your dataset, allowing you to include other columns from your data into the analysis. With their flexible structure, pivot tables enable you to:
- Interactively compare different data points, uncover trends, and identify patterns.
- Dive deeper into your data by including additional columns for a more comprehensive view.
- Seamlessly construct and modify data relationships and comparisons, much like crafting pivot tables in Excel.
How to Access and Create Pivot Tables?
Step 1: Log into Kimola Dashboard
Begin by logging into your Kimola account to access all your data tools.
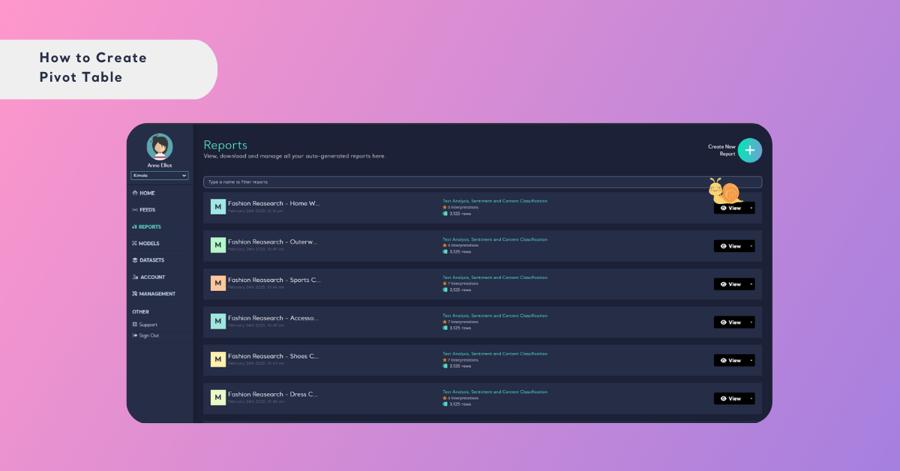
Step 2: Navigate to the Reports Page
Once inside, head over to the reports page, your central hub for all analyzed data.

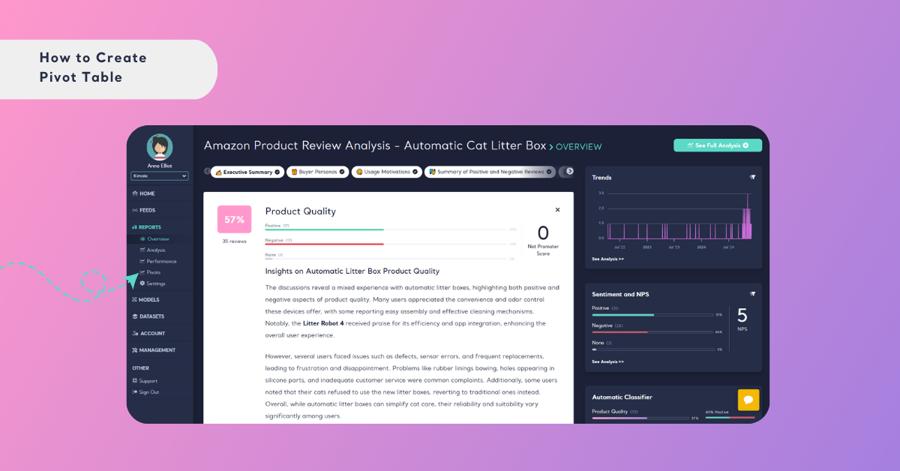
Step 3: Open Your Report
Select and open the report you wish to work with by clicking the title, icon, or "View" button.
Step 4. Access the Pivot Page
Within your report, locate the “Pivots” section, usually found in the left panel, to enter the world of data insights.
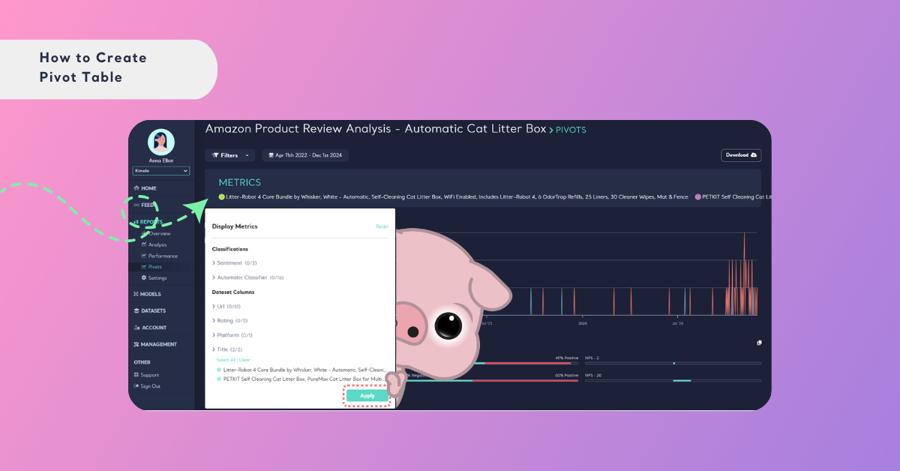
Step 5: Create Your Pivot Table
Choose the variables you wish to compare by selecting them from the Metrics dropdown menu.
- After making your selections, click the apply button.
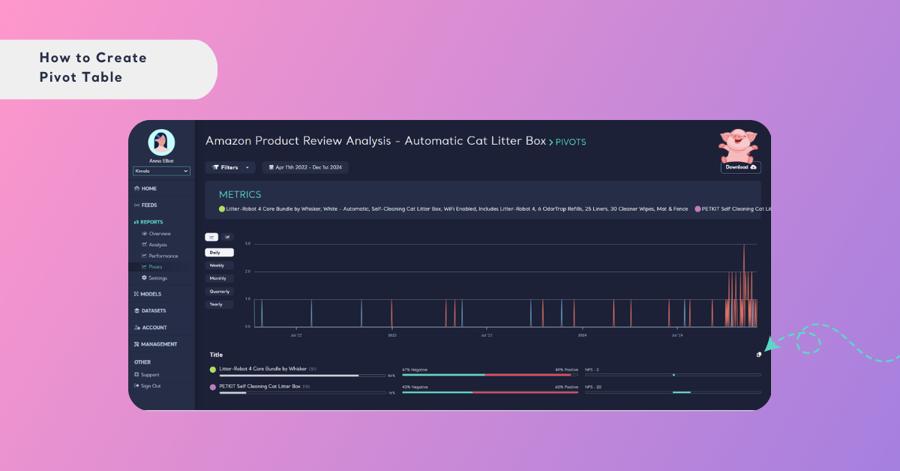
- You'll instantly see the sentiment and NPS comparisons for the variables in each column you've chosen.
Looking to present your pivot table metrics in a new and interesting way? You can easily do so by using the copy feature. Simply click the copy button located in the upper right corner of your pivot tables. This allows you to replicate the data and visualize it in a different format, ready to share or incorporate into other analyses. It's a creative and flexible approach to showcasing your data insights.
To download your pivot table as a presentation-ready PowerPoint file, just click the "download" button located in the top-right corner of the screen.
Pivot tables unlock the full potential of your data by giving you the flexibility to view and analyze it from diverse perspectives. Whether you're exploring sales trends, comparing demographic segments, or identifying performance drivers, pivot tables are your invaluable allies in turning complex datasets into clear, actionable insights. Grab hold of these tools within your Kimola reports and power up your data analysis today!