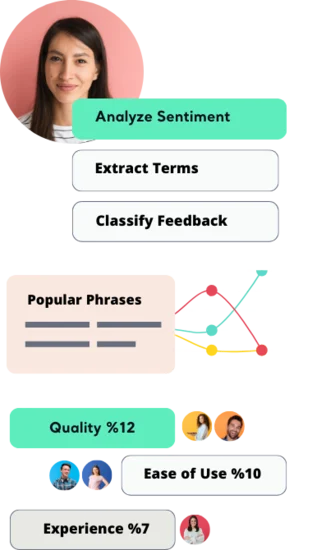
Themes and Summaries
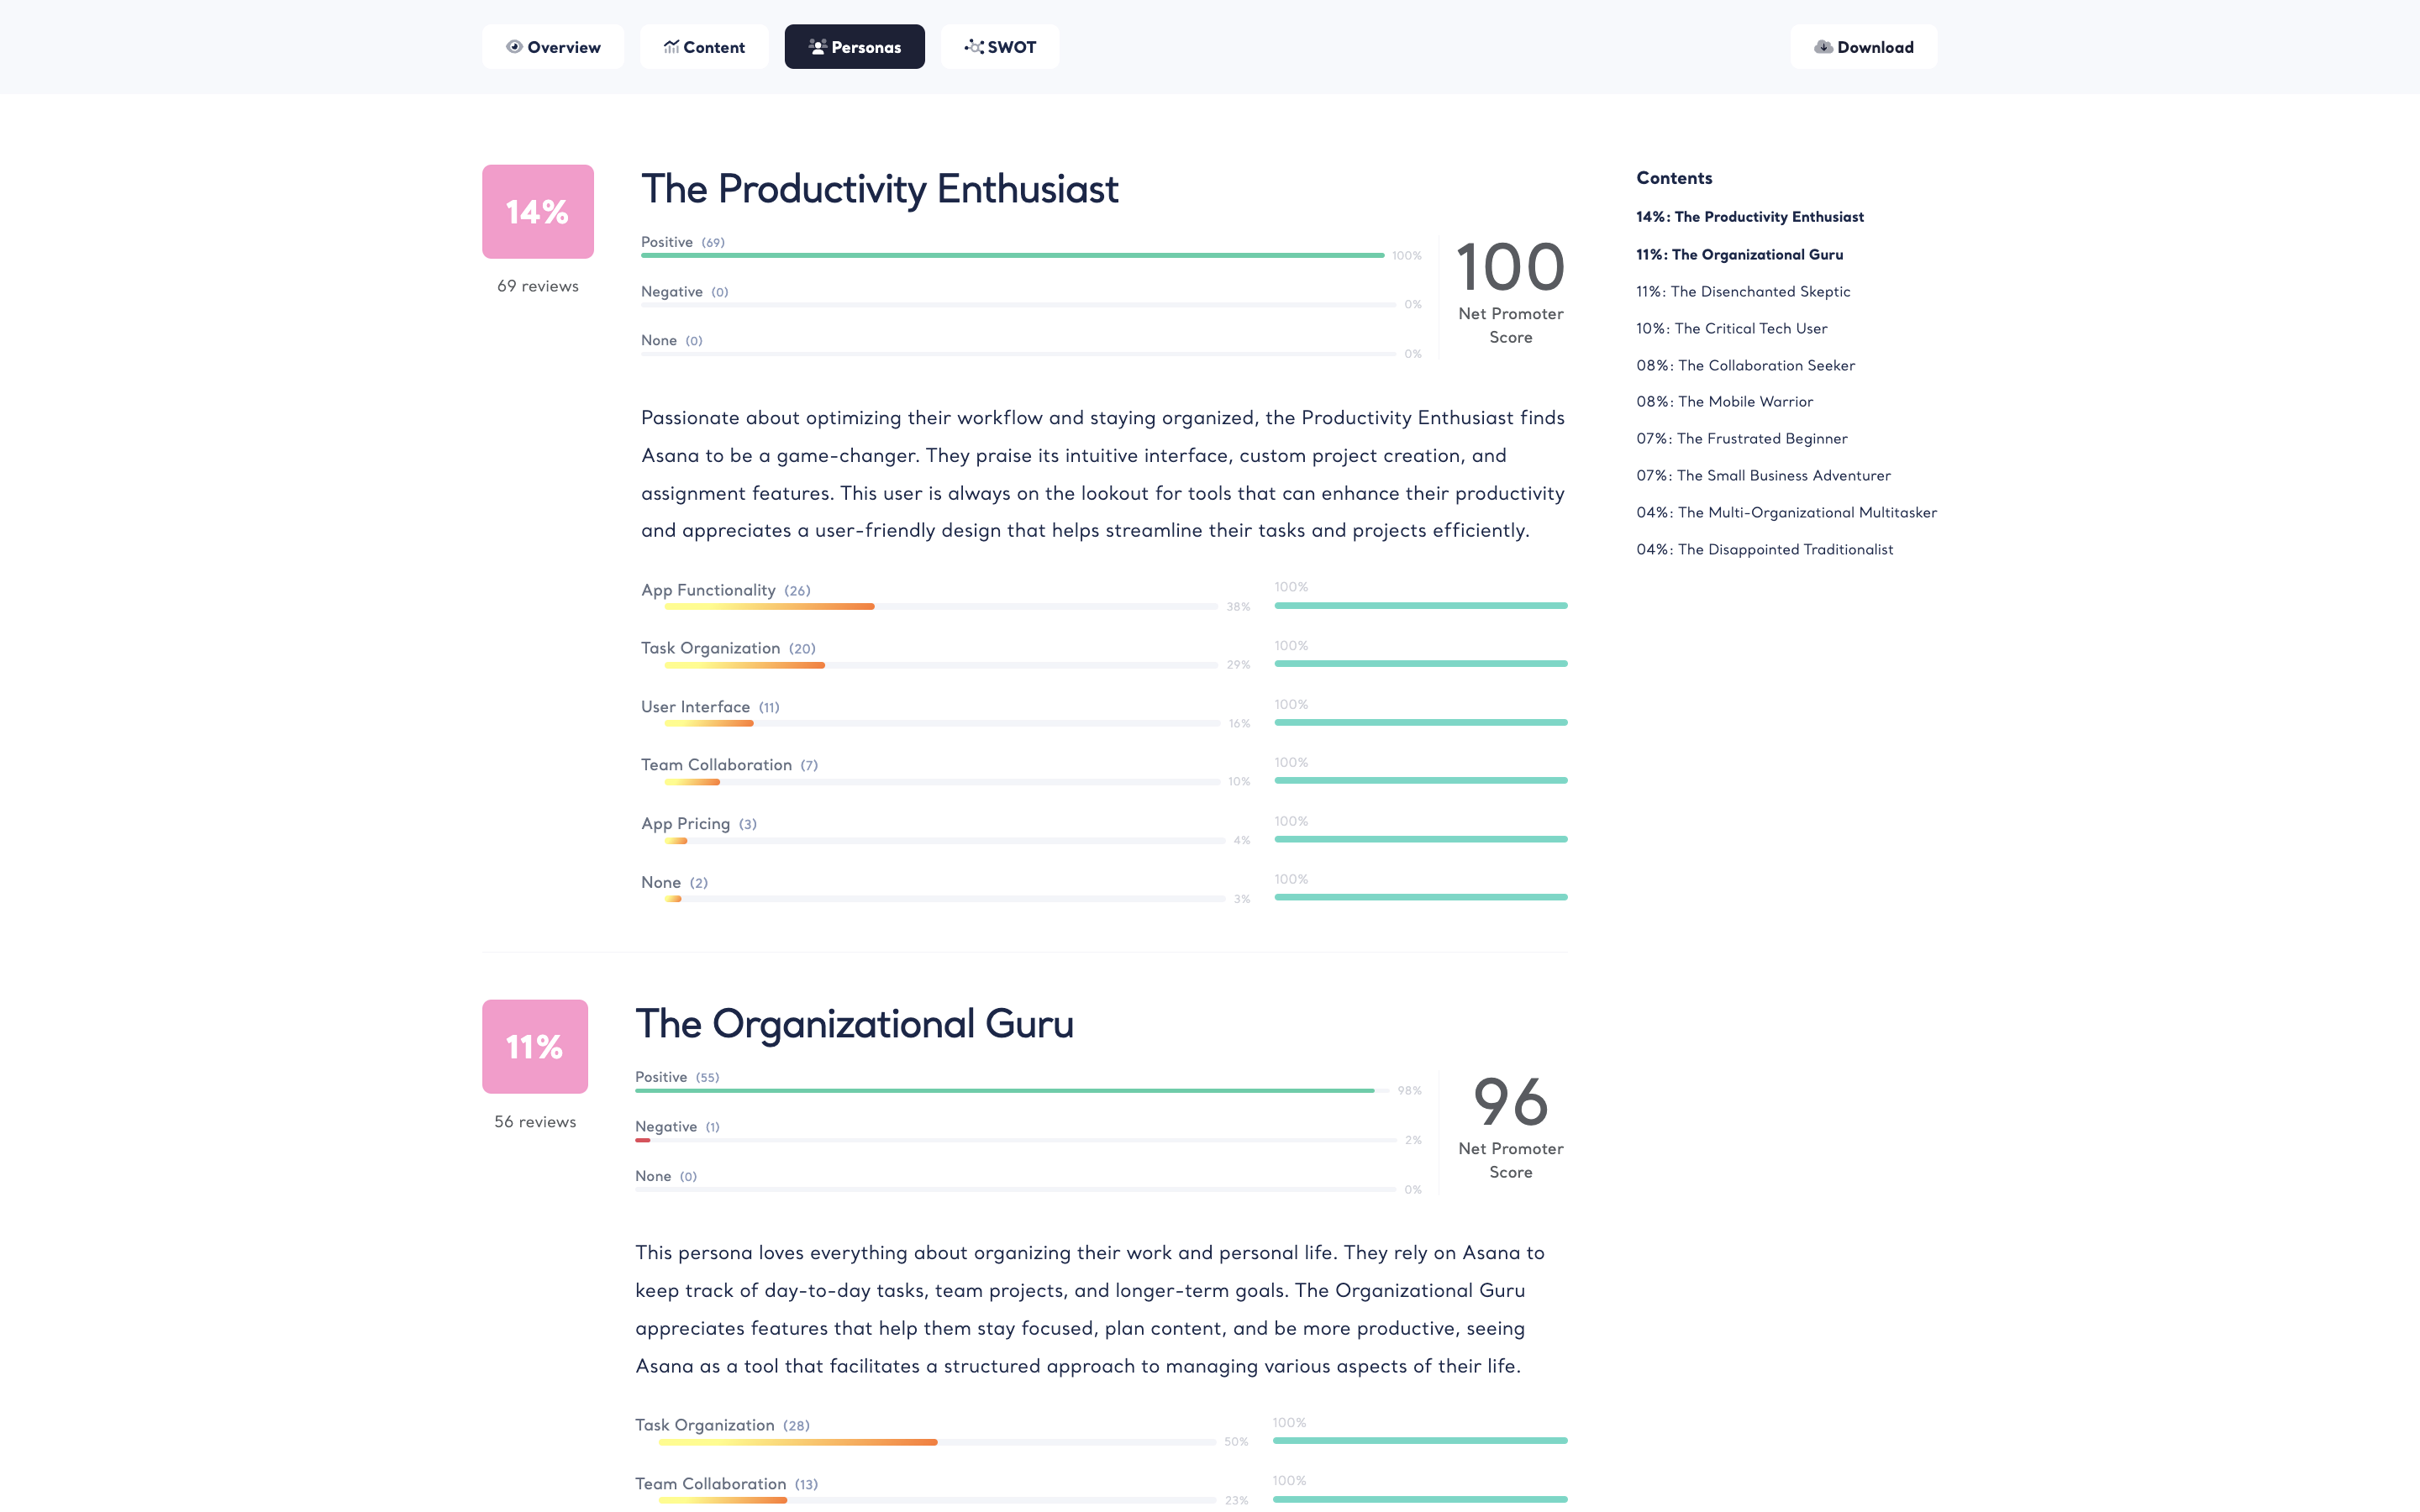
Discover Buyer Personas
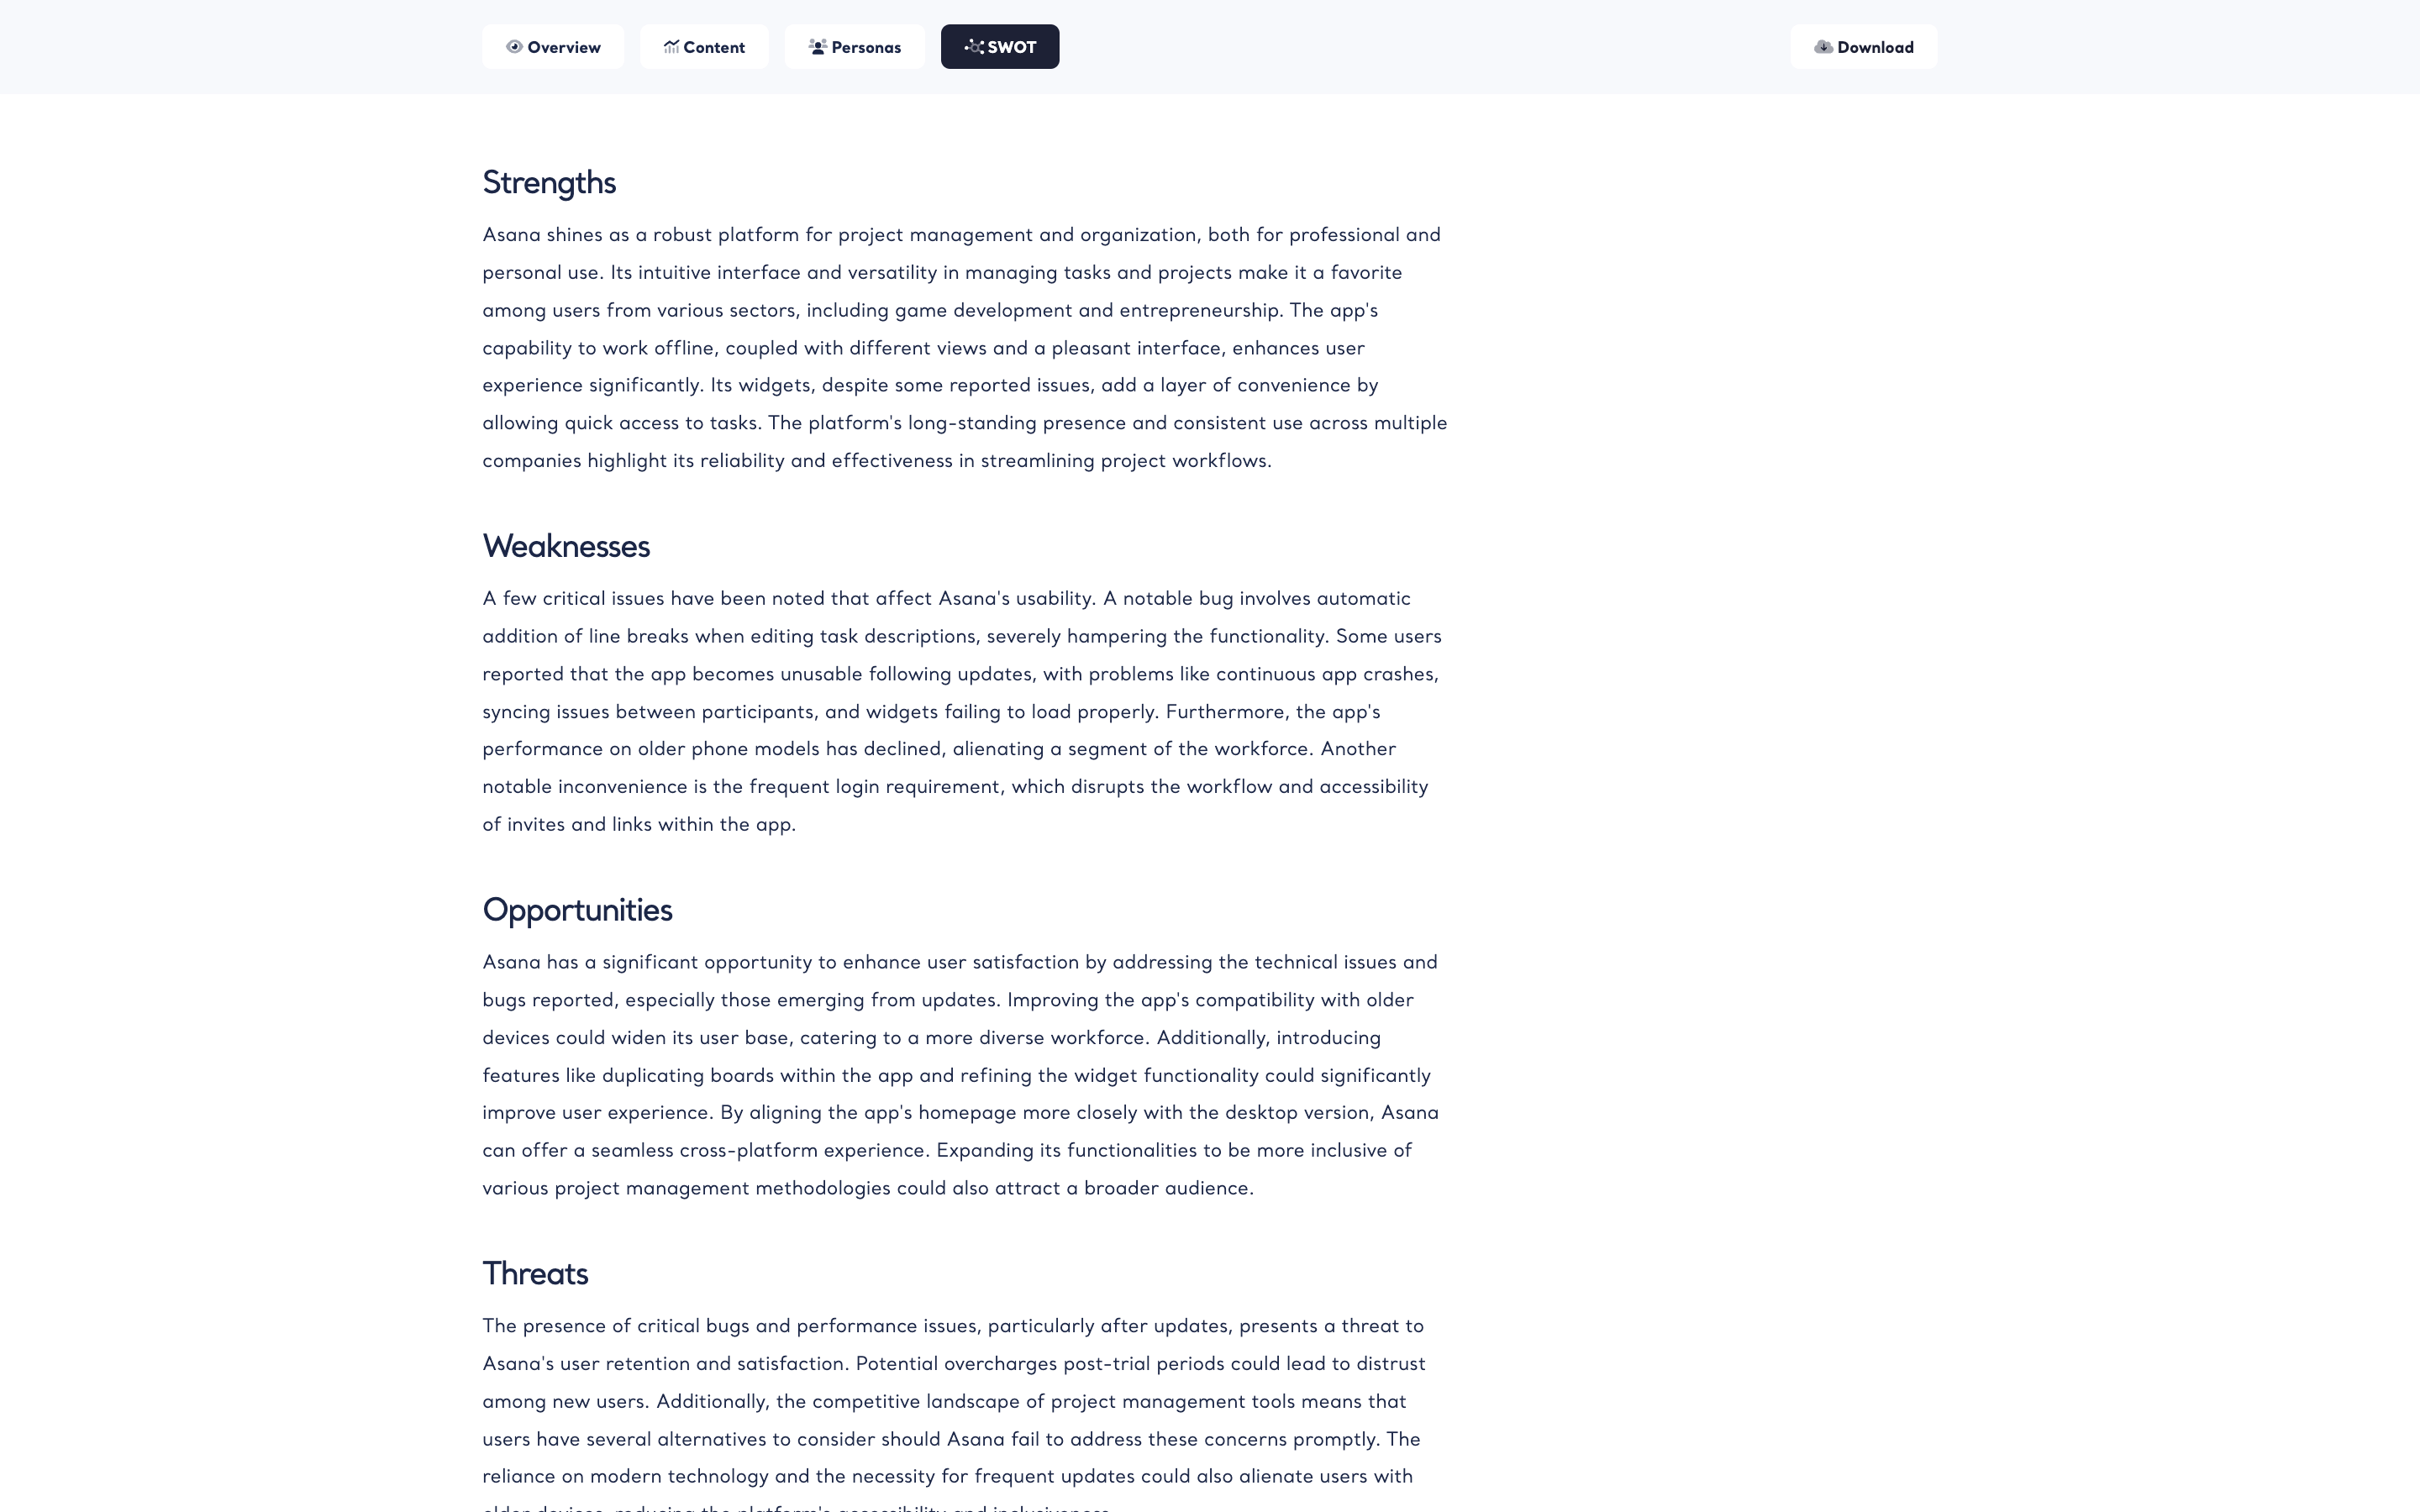
Build Strategies Based on SWOT Analysis
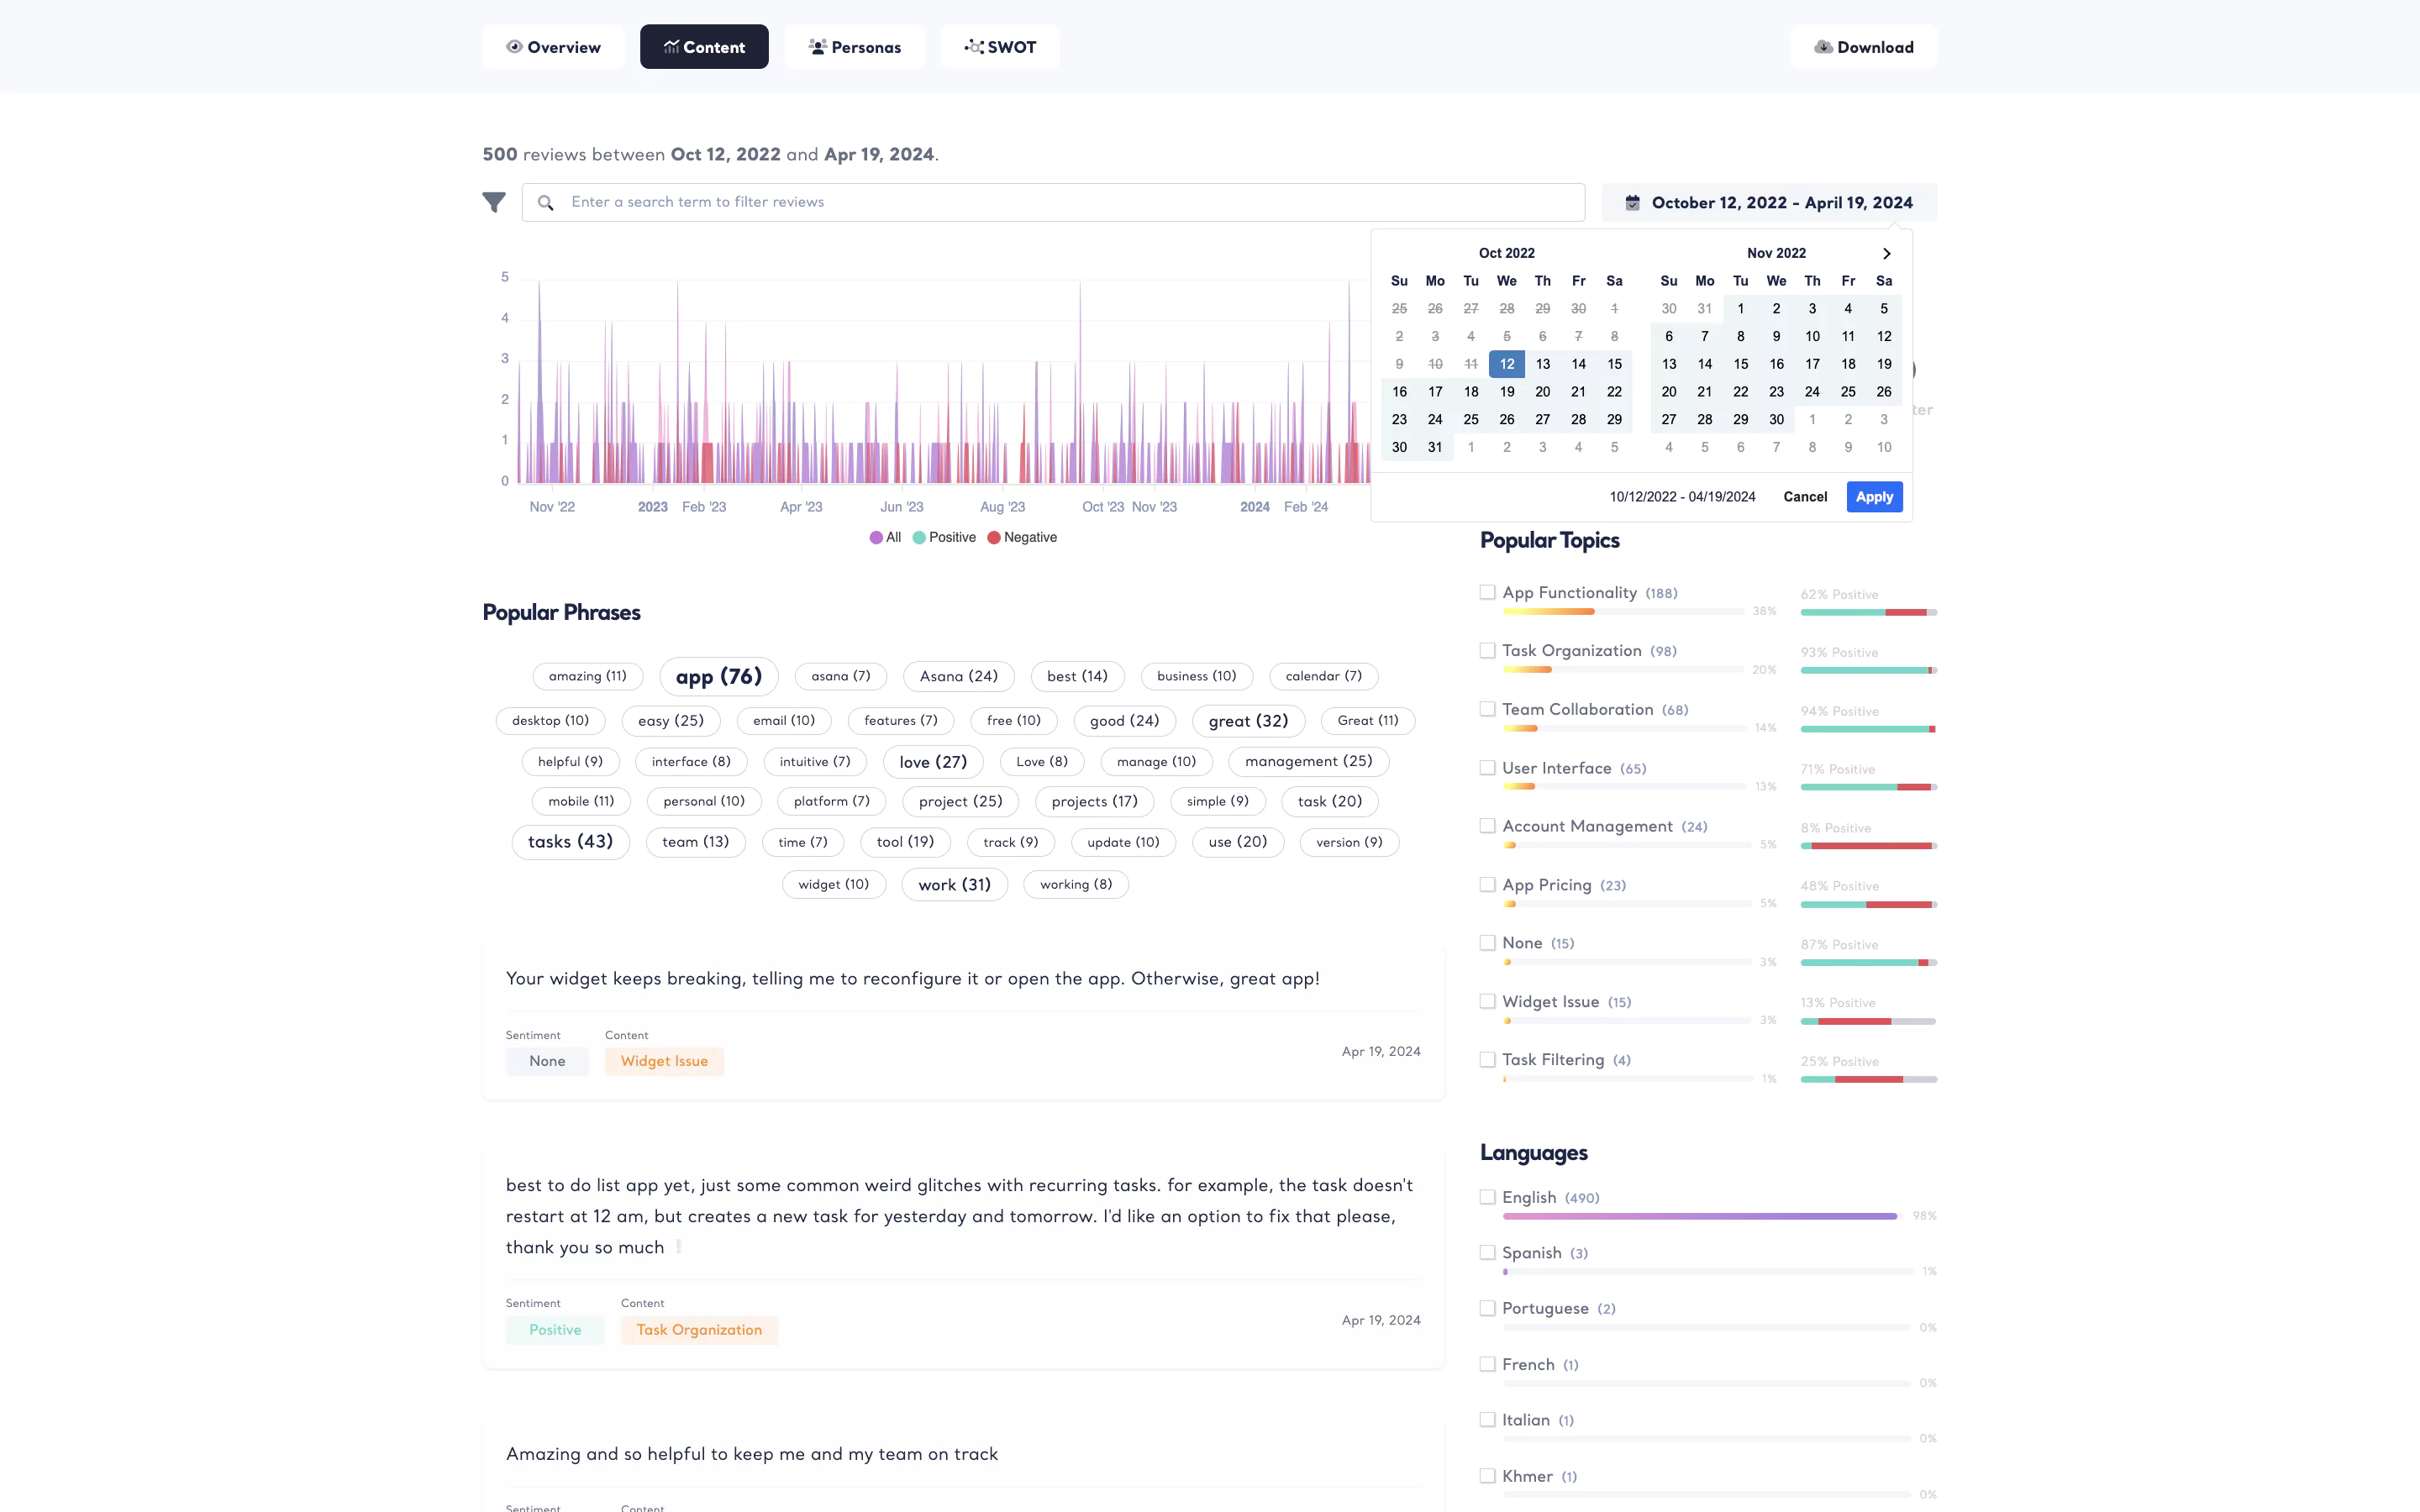
Unlock & Dive Deeper to Popular Phrases
Dive into Emotions with Sentiment Analysis!
Filter Through Clarity with Classification!
Cultural Curiosity: Gain Deeper Insights with Language Filtering
Use advanced filters to enhance CX.
Unlock customer review analysis with all features, right away.
Unlock customer review analysis with all features, right away.
Search specifics with upgrading!
Never miss a single review!
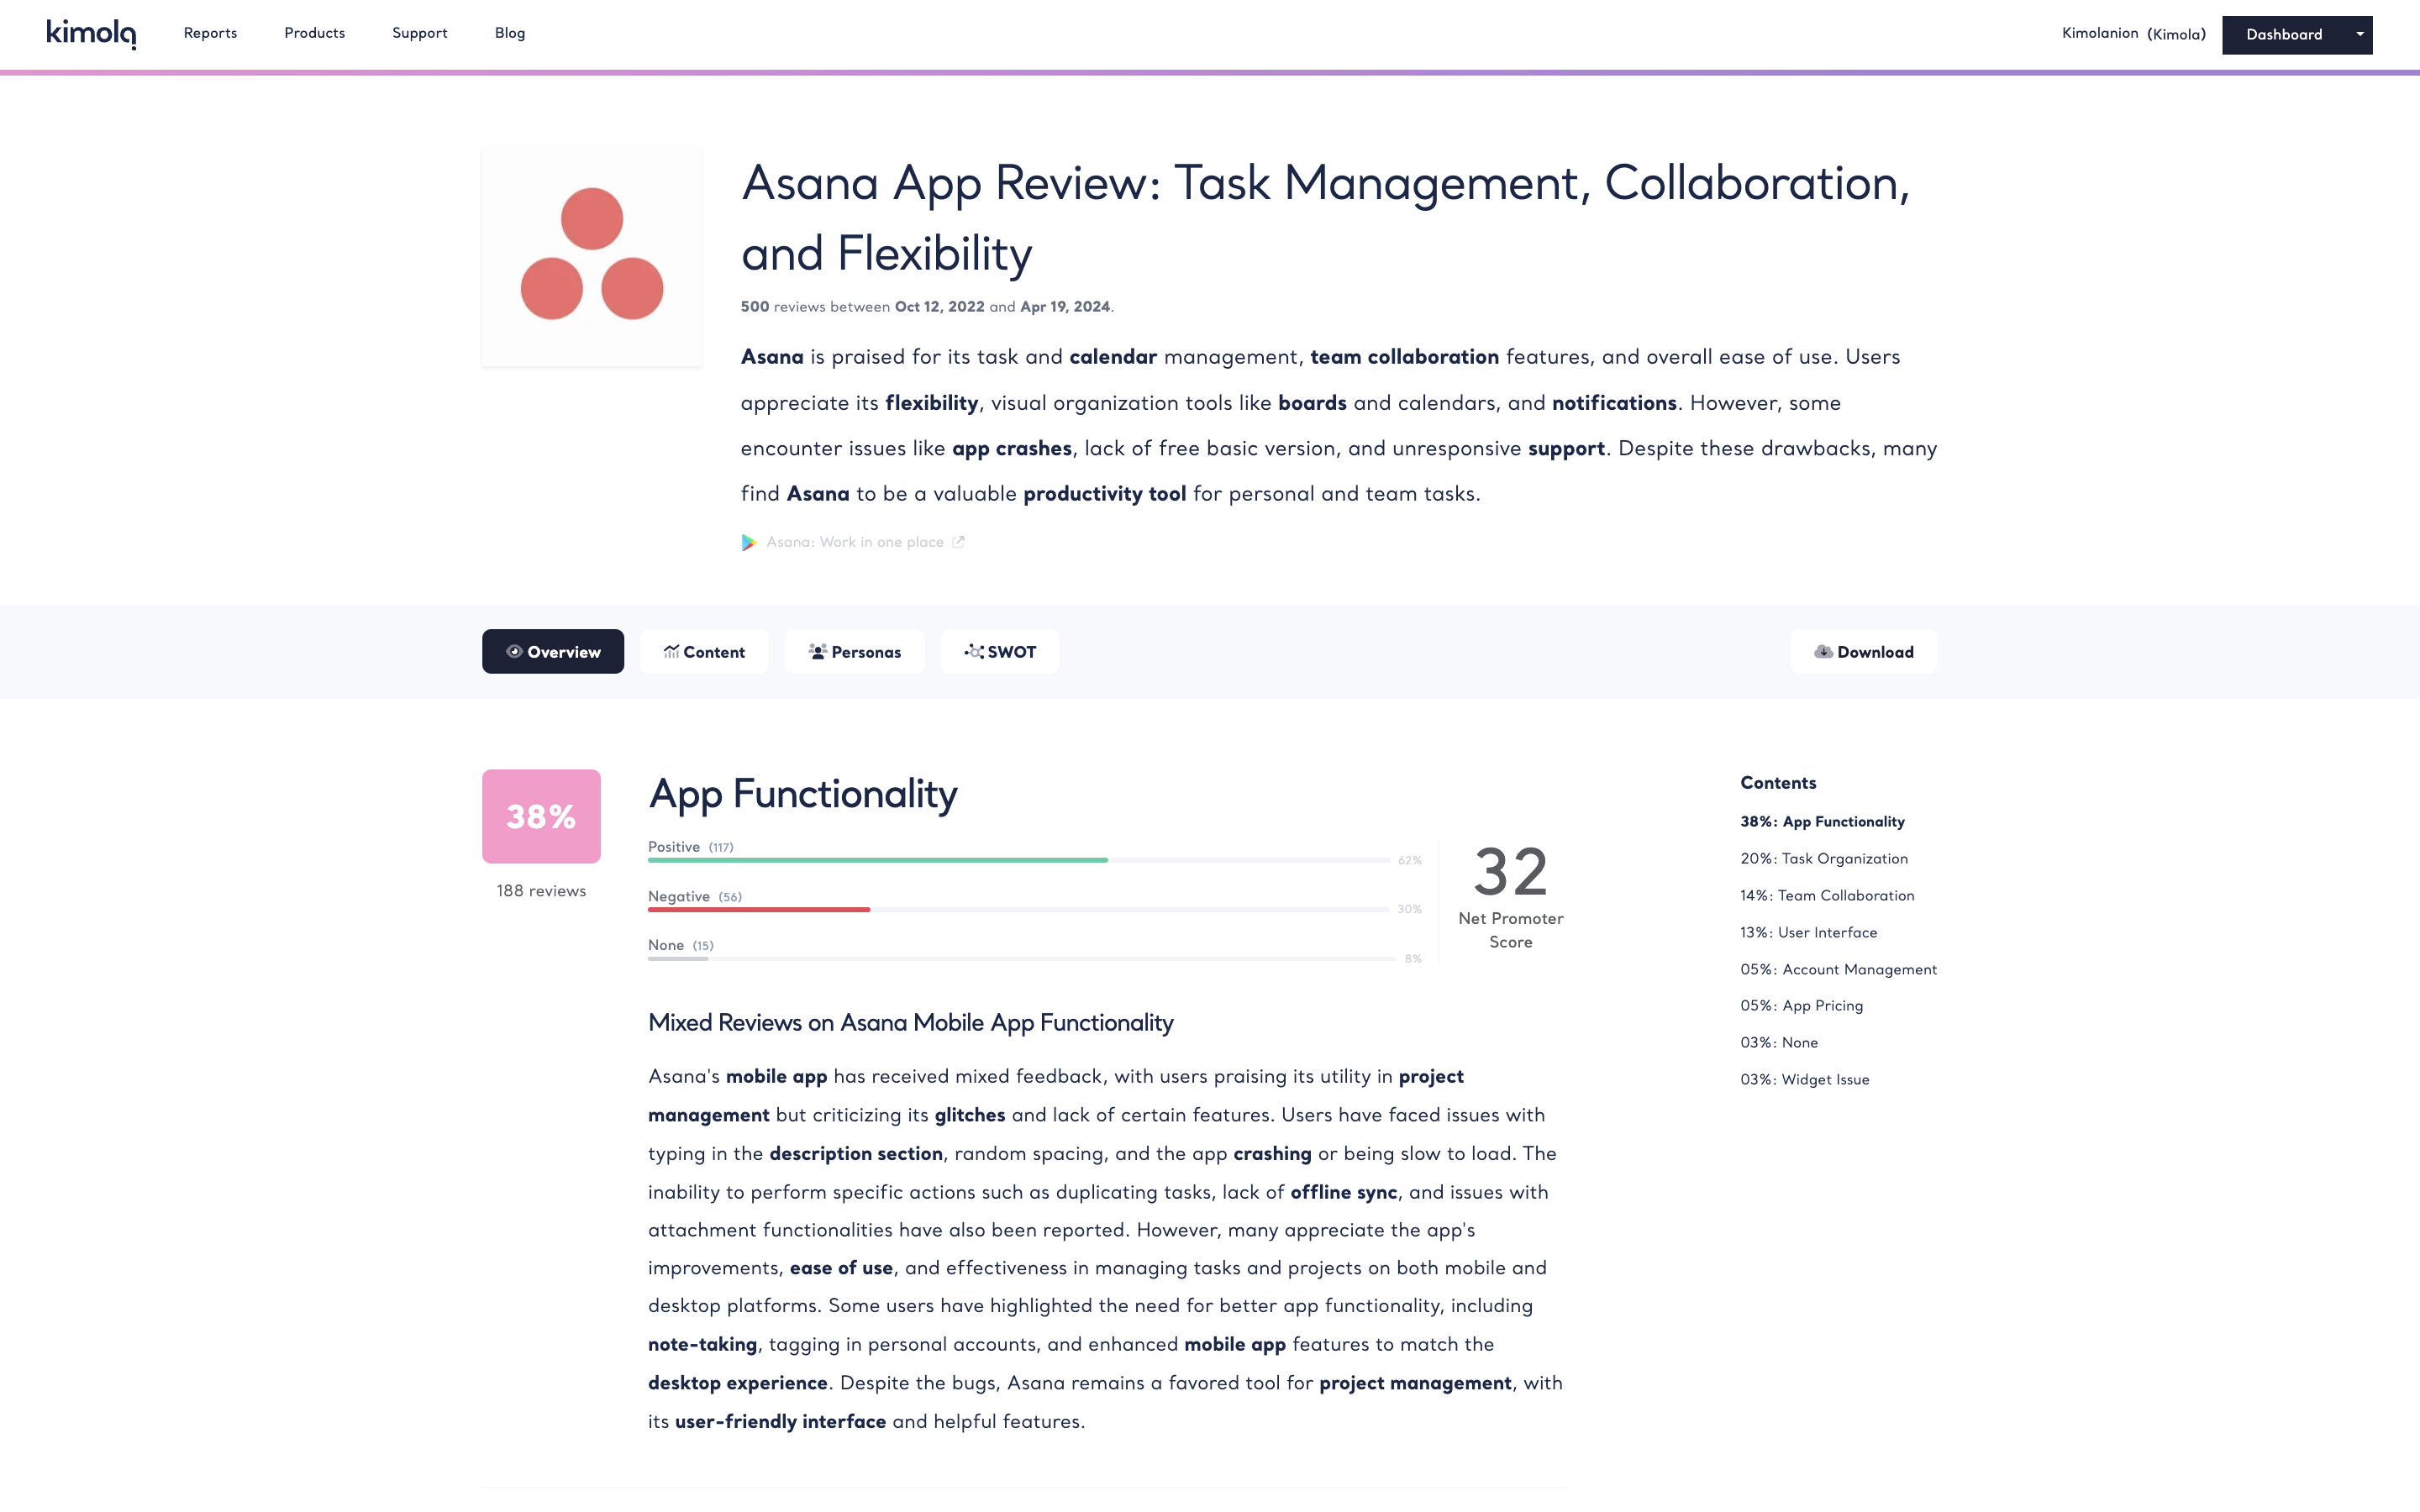
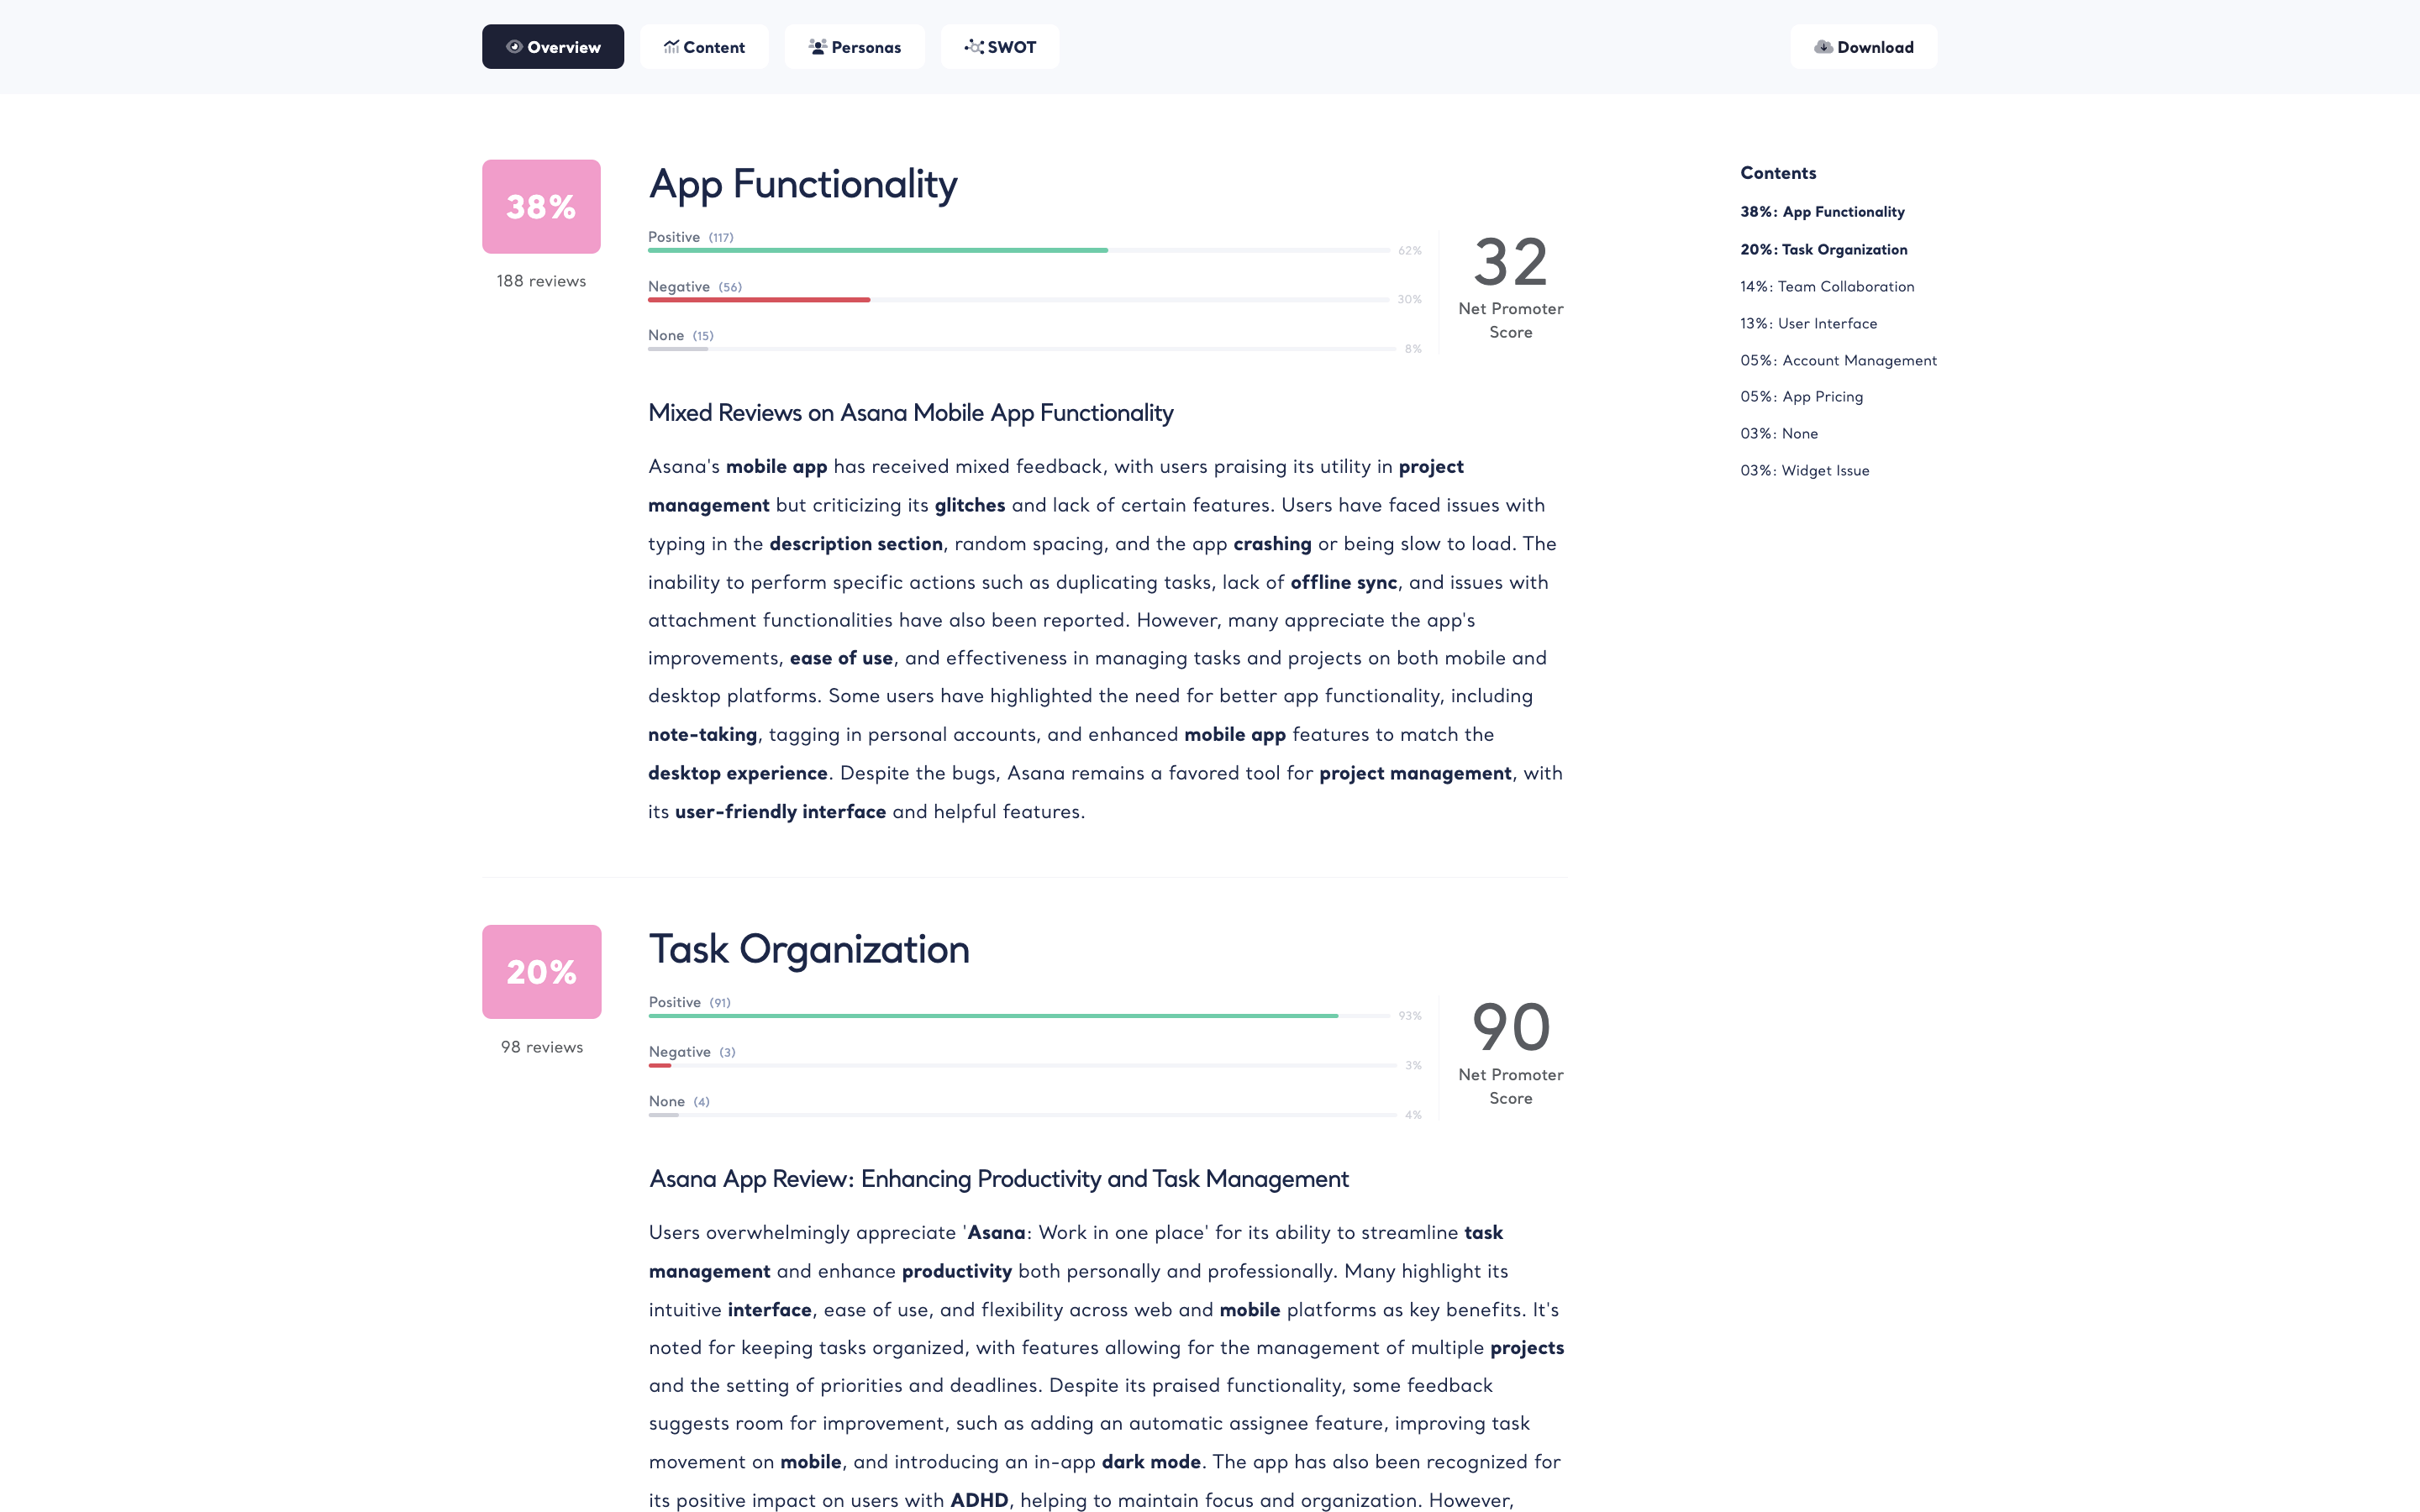
See how your data is clustered under different themes, with summaries of the data within each theme.
Discover the fictional profiles with detailed descriptions of people who represent the audience in your dataset.
Identify core strengths, weaknesses, opportunities, and threats to facilitate a realistic, fact-based, data-driven assessment of an organization.
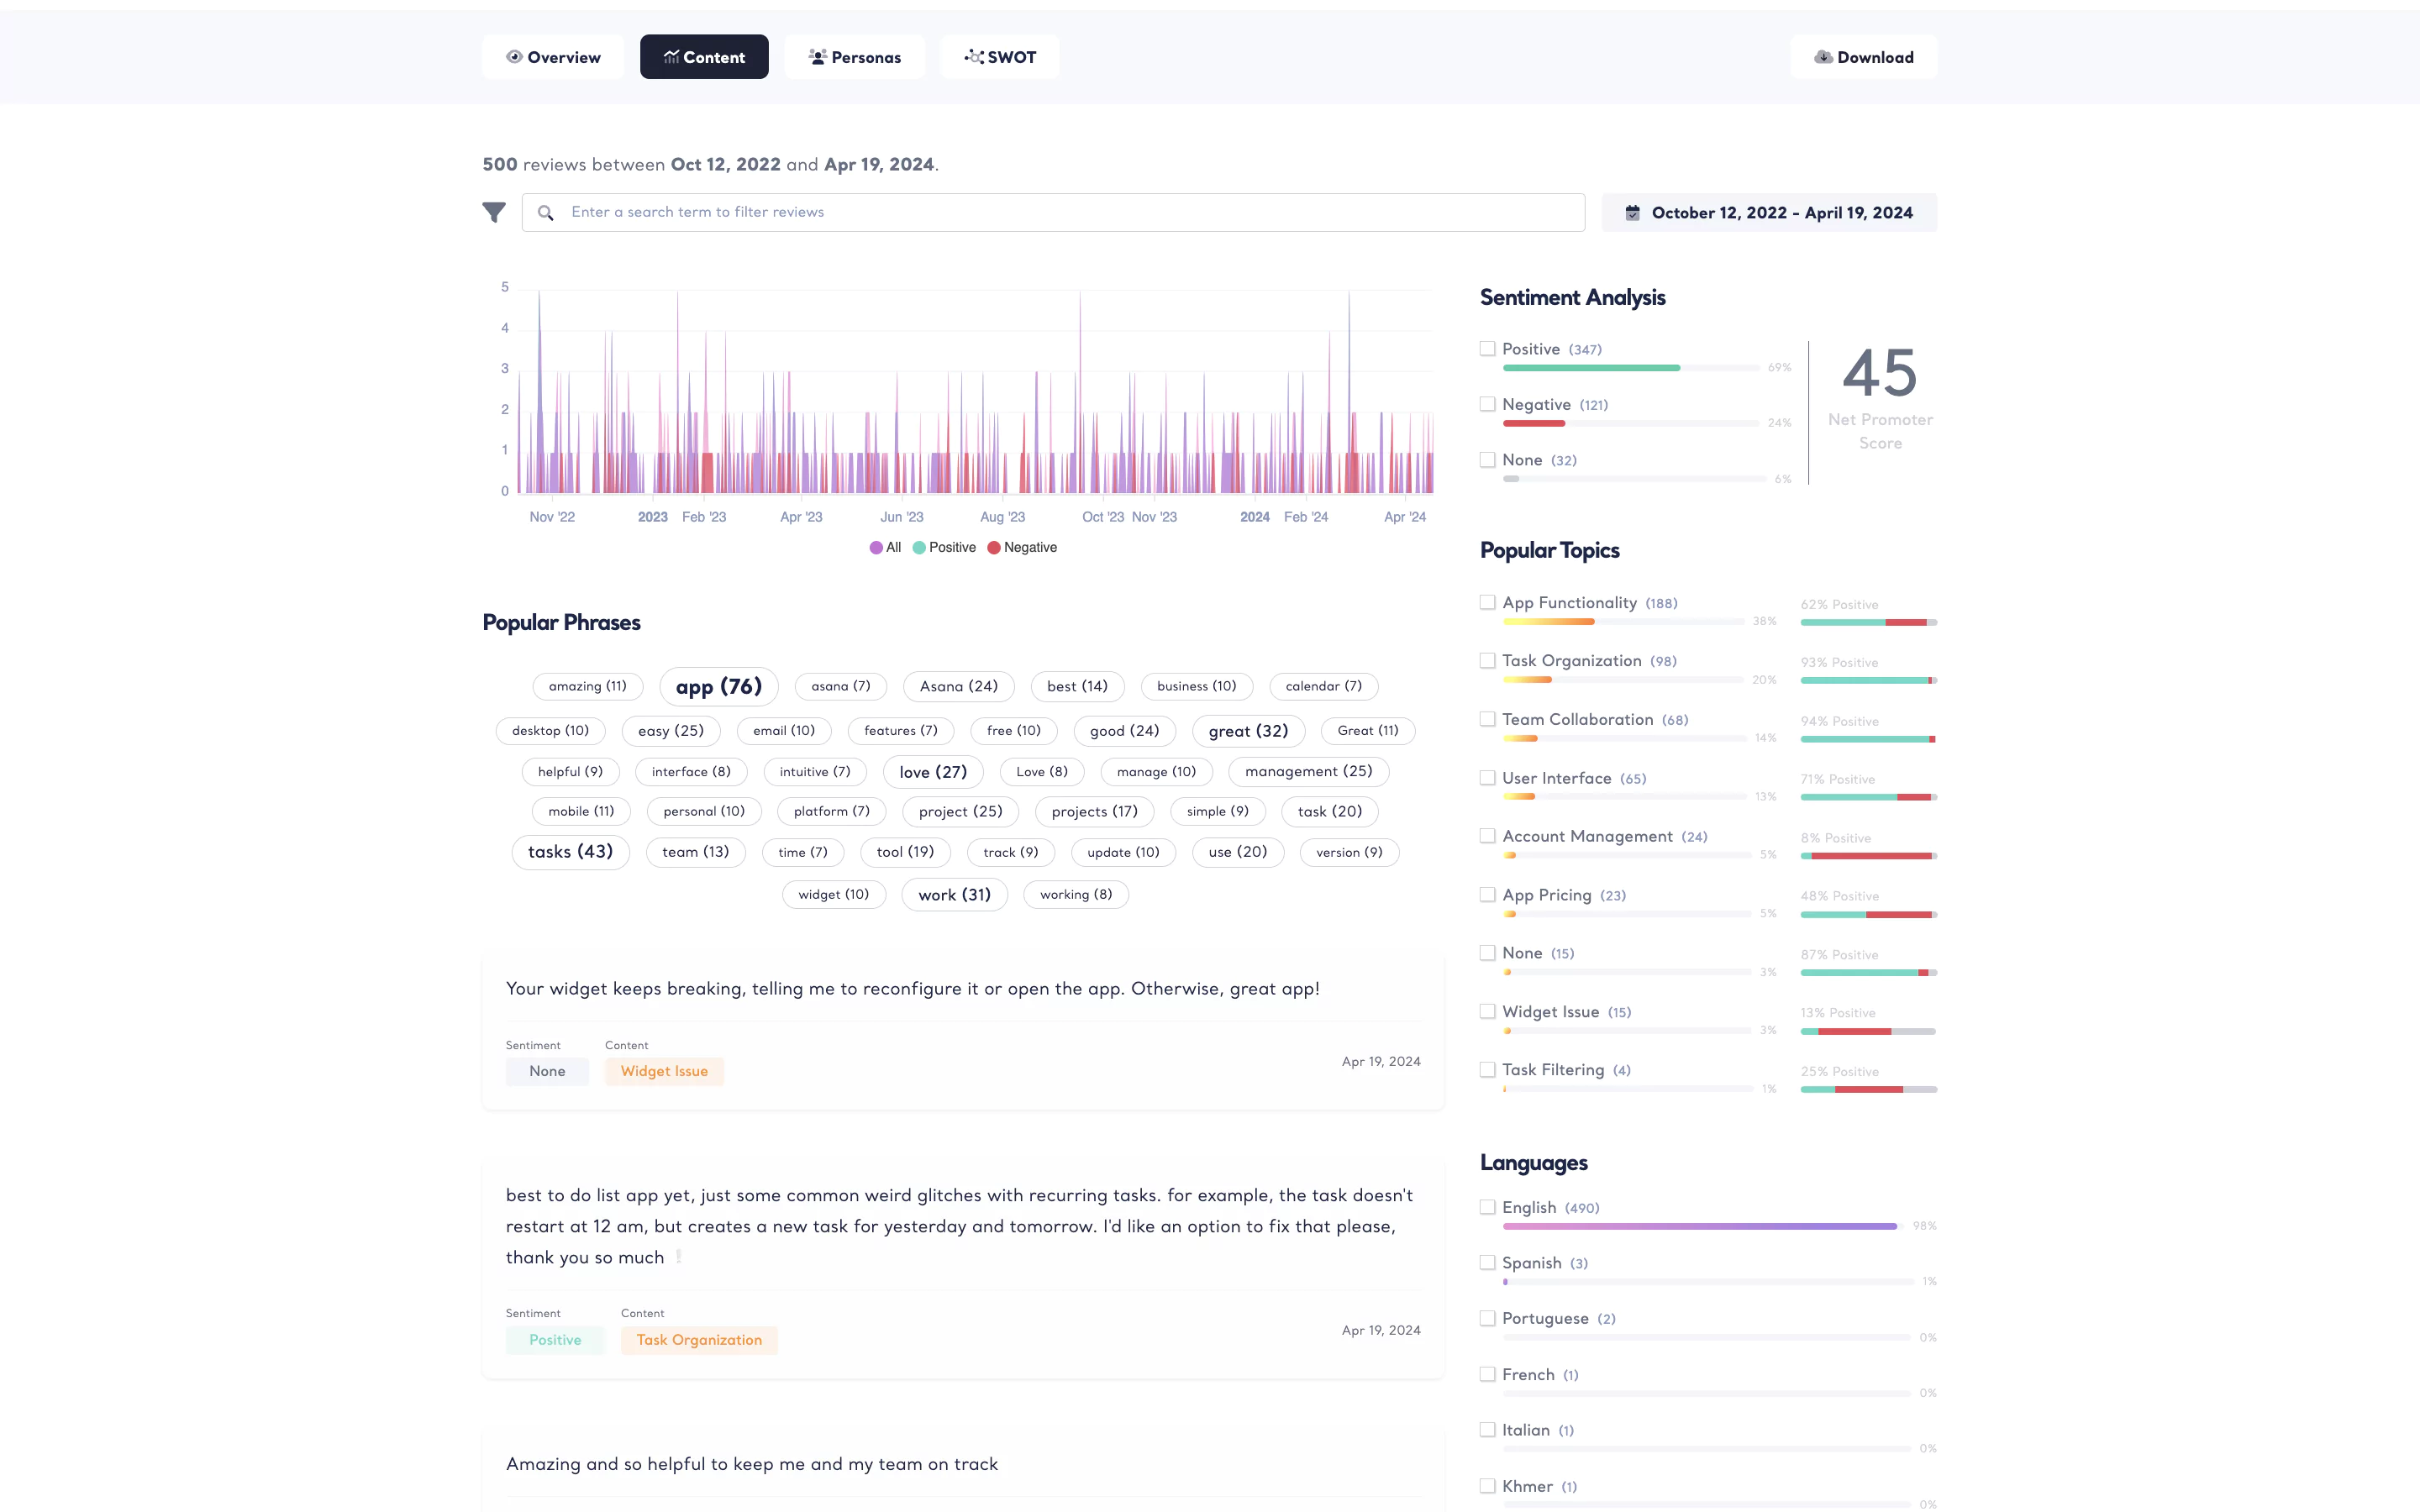
Understanding popular phrases provides insights into how you connect with your customers. Unlock popular phrases filter and benefit all these features that come with purchasing this report:
Emotions rule the world and also your next customers. Unlock sentiment analysis filter and benefit all these features that come withpurchasing this report:
Classification is the backbone of a research and we’re here to enable research for everyone! Unlock classification filter and benefit all these features that come with purchasing this report:
Cultural insights are always valuable. Gain deeper insights by filtering language in customer reviews by purchasing this report! Unlock language filter and benefit all these features that come with it:
Right now, you’re only viewing analysis of 30 reviews. Benefit all these features below that come with purchasing report:
Right now, you’re only viewing analysis of 30 reviews. Buy this report and benefit all these features below that come with the purchase:
Right now, you’re only viewing analysis of 30 reviews. Purchase this report and benefit all these features below:
Understanding customer reviews with a holistic point of view matters. Right now, you're only viewing the analysis of 30 reviews. Purchase this report to view all and benefit these features:
Right now, you're only viewing analysis of 30 reviews. Benefit all these features below that come with purchasing report:
- Summaries
- SWOT Analysis
- Buyer Personas
- Search in reviews
- Filter by sentiment
- Filter by popular topics
- Filter by popular phrases
- Filter by language
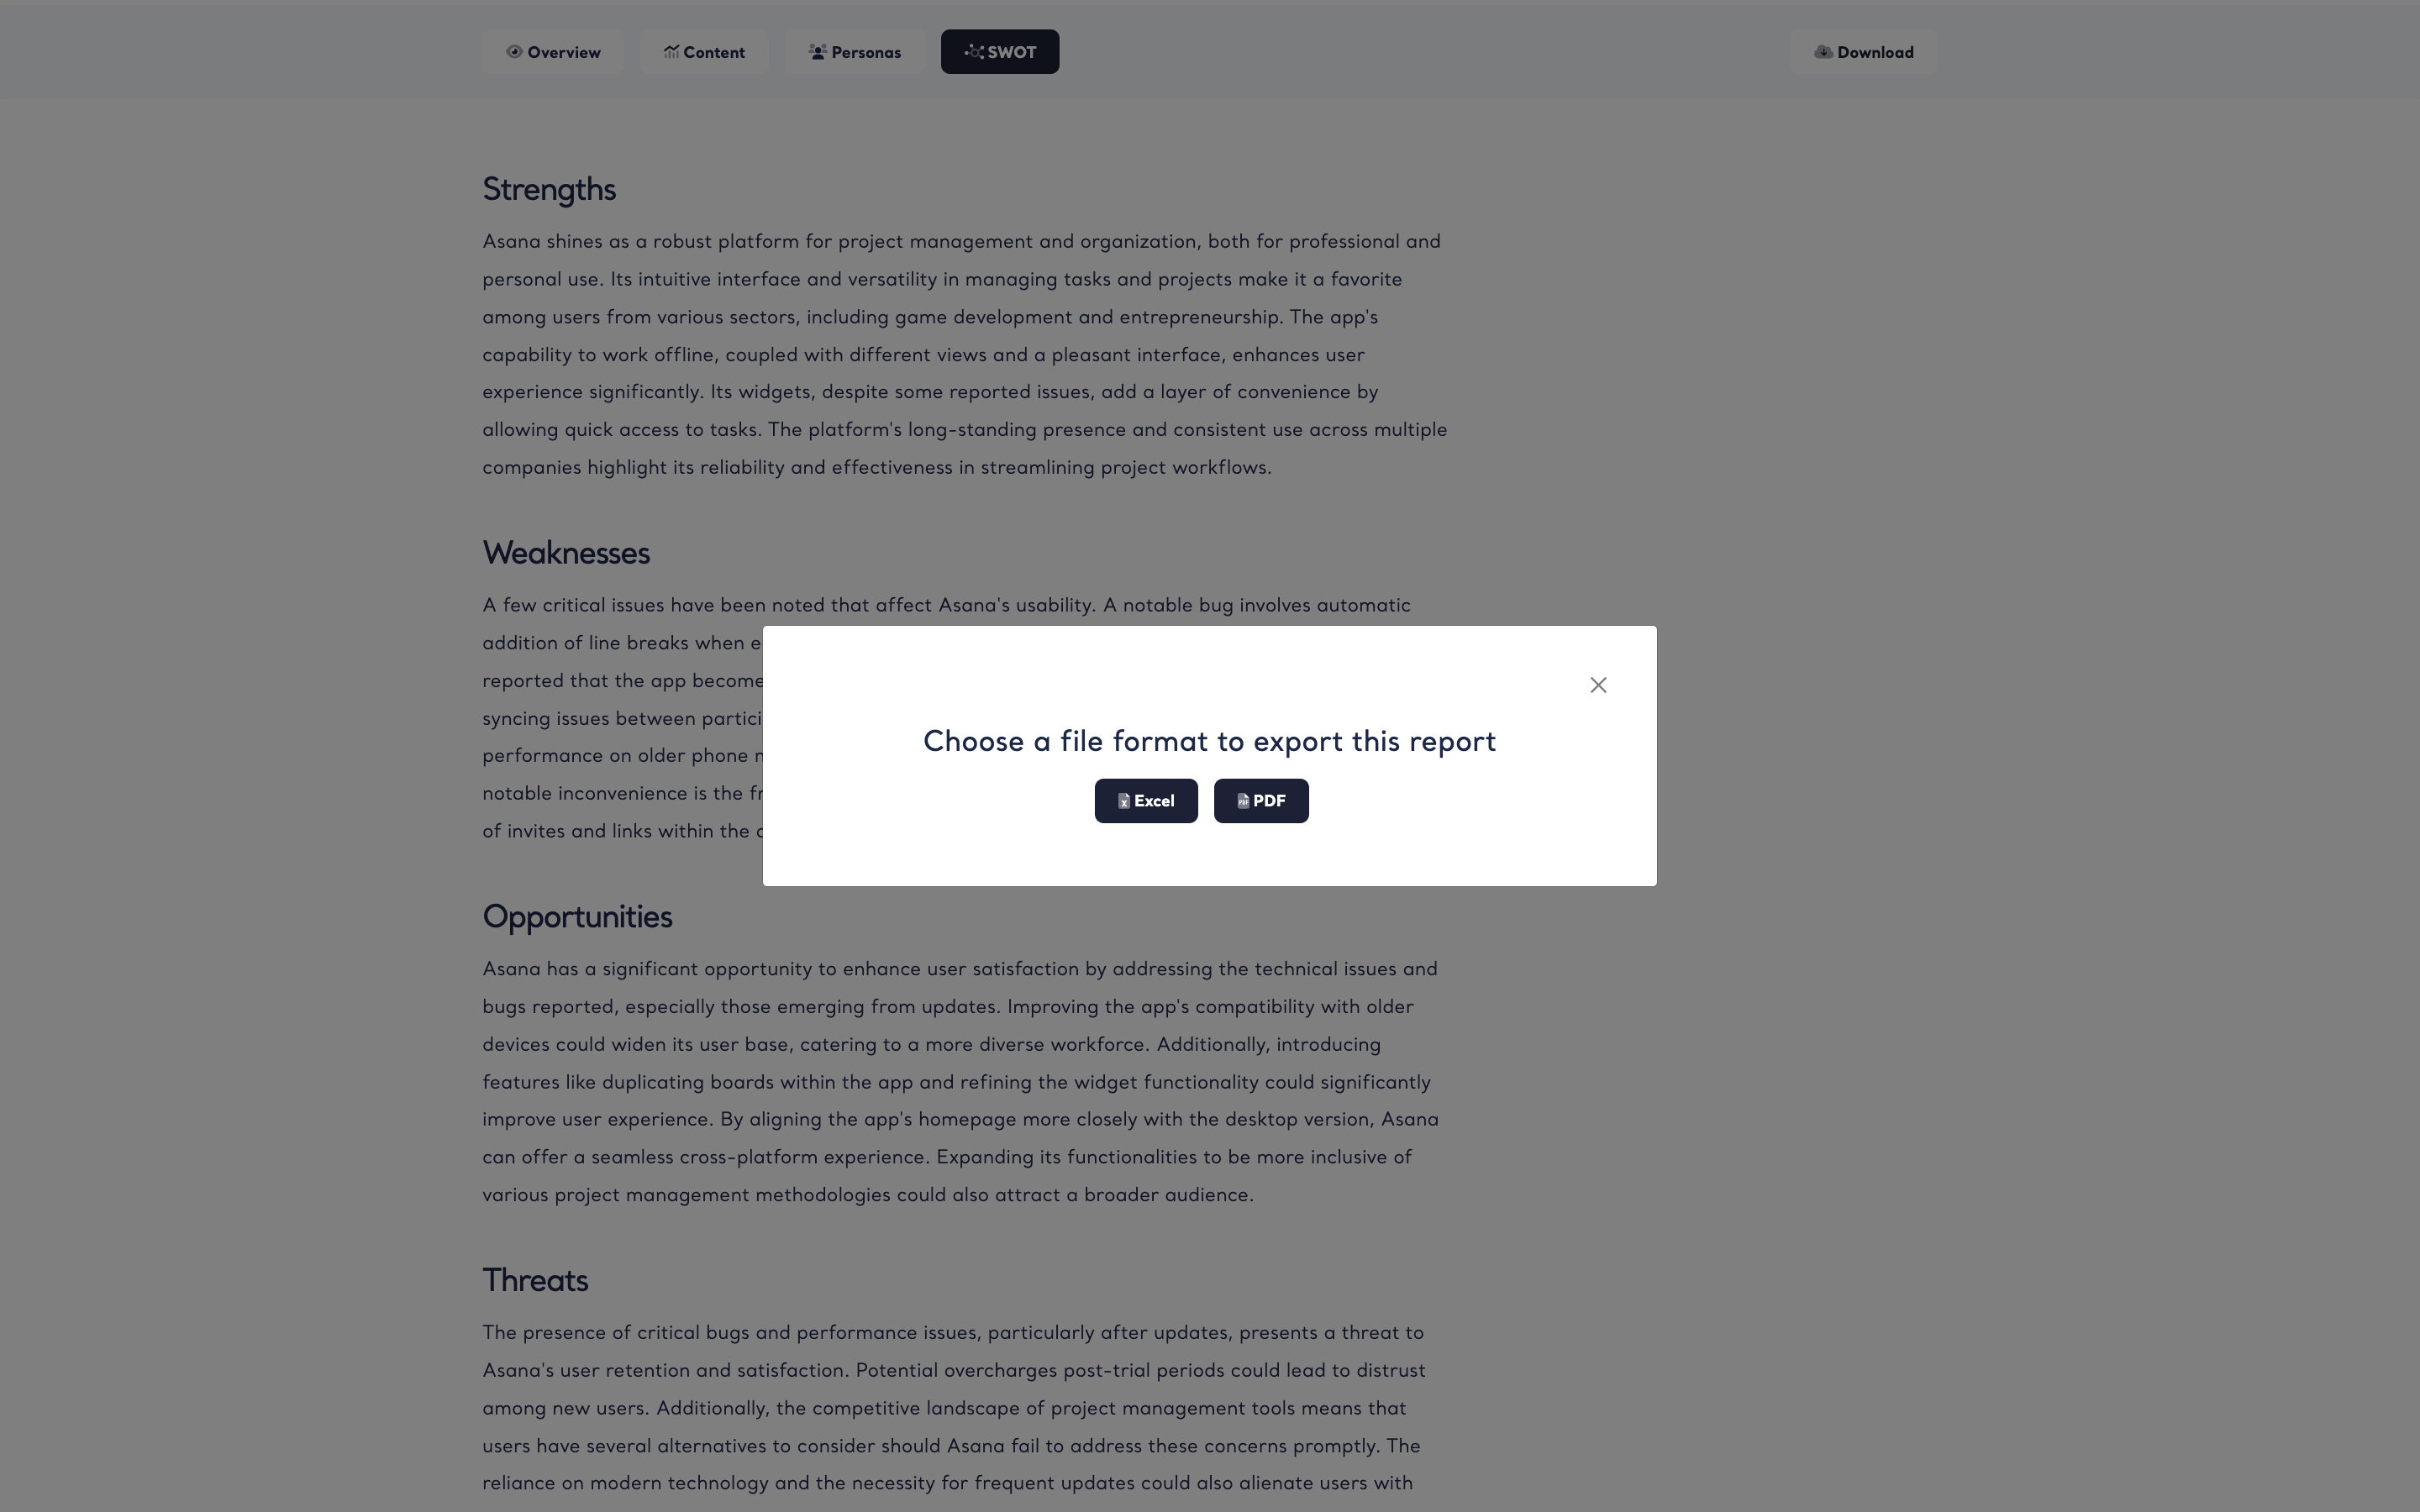
- Export to Excel
- Export to PDF
- Export to PowerPoint
41 users purchased a report in the last 24 hours.
Buy Now!
One-time purchase · No hidden costs · No recurring costs


